
Learn DAX in Power BI Using Bank Customer Dataset: KPIs and Visual Analytics Approach
In today’s data-driven world, learning DAX (Data Analysis Expressions) is essential for anyone working with Power BI. However, the best […]
In today’s data-driven world, learning DAX (Data Analysis Expressions) is essential for anyone working with Power BI. However, the best […]
Pandas is one of the most powerful and widely used libraries in Python for data analysis and manipulation. Whether you
Introduction In today’s data-driven world, the ability to transform raw medical data into meaningful insights is not just a technical
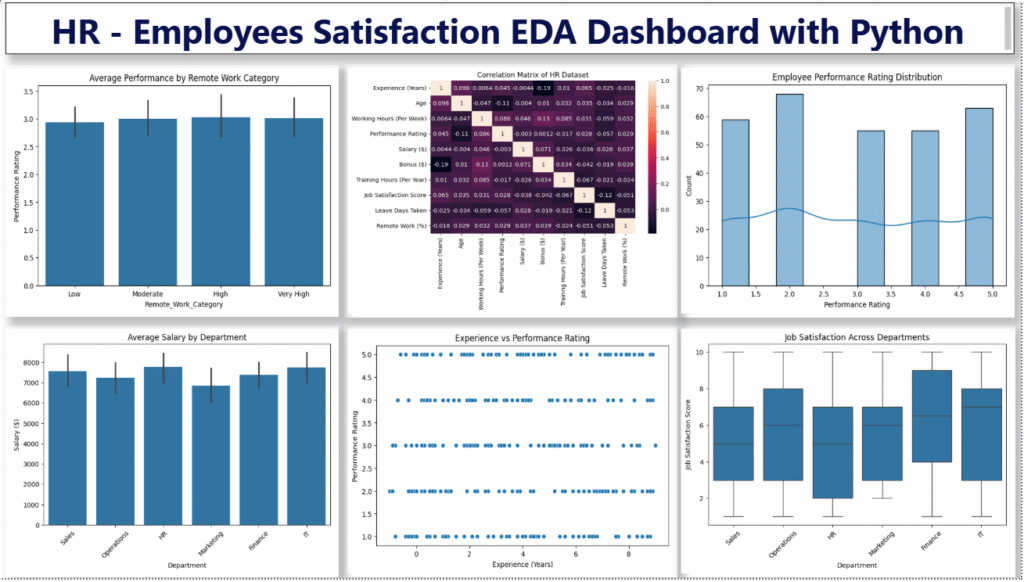
Dataset Overview Get the Dataset here: https://colorstech.net/power-bi/human-resources-hr-employee-performance-dataset/ Columns in the Dataset This Dataset is Good For EDA Topics Like This
Hello, I am Ankit Srivastava, a Data Analytics Professional passionate about transforming complex data into meaningful insights that help businesses
Introduction In today’s data-driven world, organizations rely heavily on data analytics to make strategic decisions, optimize operations, and understand customer
In today’s competitive environment, supply chains are no longer just operational backbones — they are strategic differentiators. The difference between
Introduction In this Tableau-focused analytical exercise, we are taking the Health Insurance Records dataset beyond simple visualization and transforming it
Introduction In this advanced DAX practice session based on the Health Insurance Records dataset, we are moving beyond basic aggregation

(Step-by-Step Windows Tutorial) Artificial Intelligence has completely changed how we create content. Instead of manually writing long-form articles, you can