
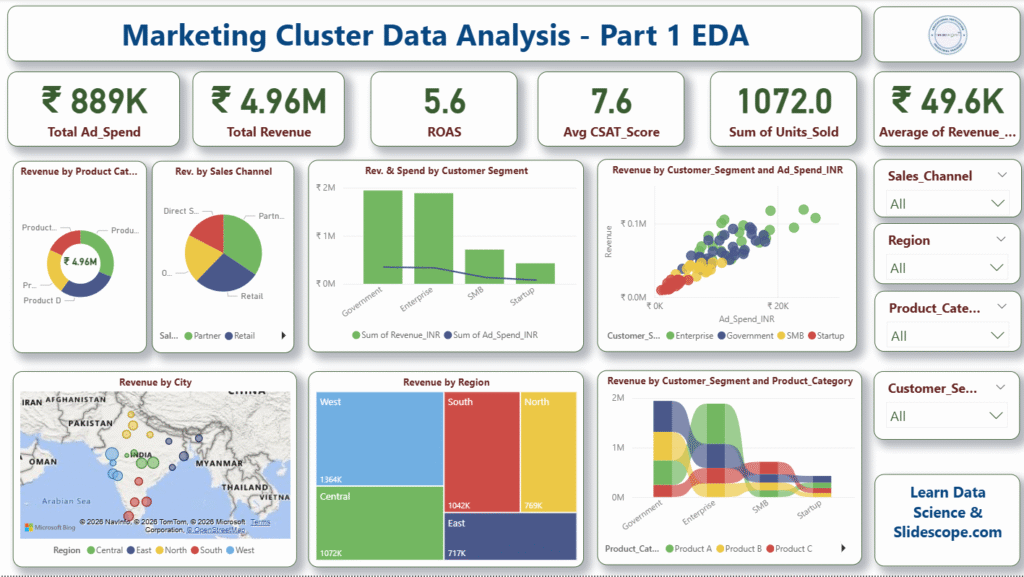
Marketing Cluster Data Analysis Dashboard in Power BI – Complete EDA Tutorial Using Excel Dataset
Hi, I’m Ankit, and in this tutorial I will guide you through the complete process of building a Marketing Cluster […]
Hi, I’m Ankit, and in this tutorial I will guide you through the complete process of building a Marketing Cluster […]
The Comprehensive Hotel Guest Analytics Dataset for Multi-City Hospitality Operations (2023–2025) is a structured and insightful dataset designed to represent
Step-by-Step Deep Tutorial By Ankit Srivastava In this tutorial, I will guide you step by step through creating a professional
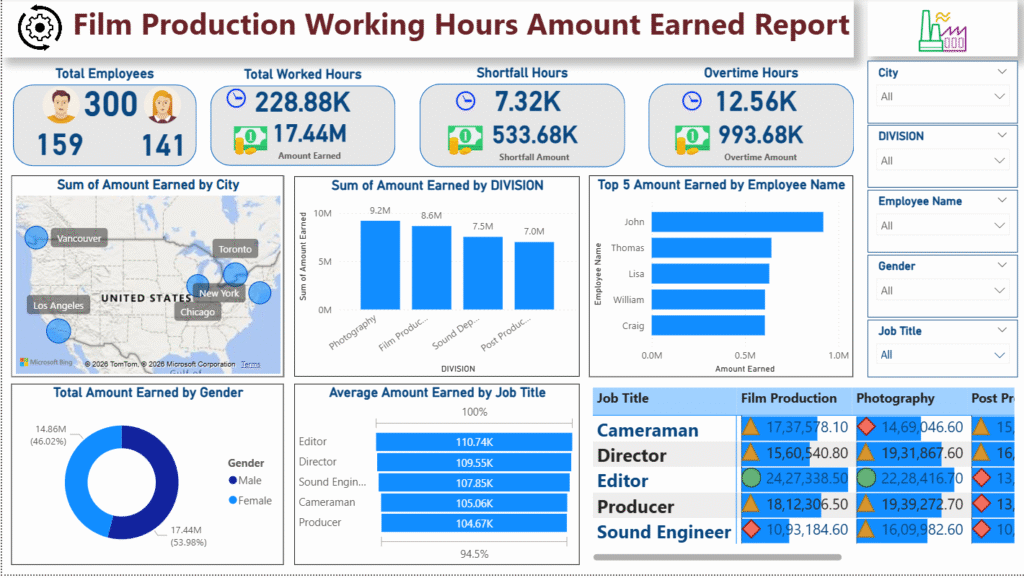
This Power BI project, Film Production Working Hours Amount Earned Report, is designed to give a comprehensive, decision-ready view of

2026 New Dashboard Design Tutorial Prepared by : Ankit Srivastava Get the Dataset Here Payroll Dataset When organizations talk about
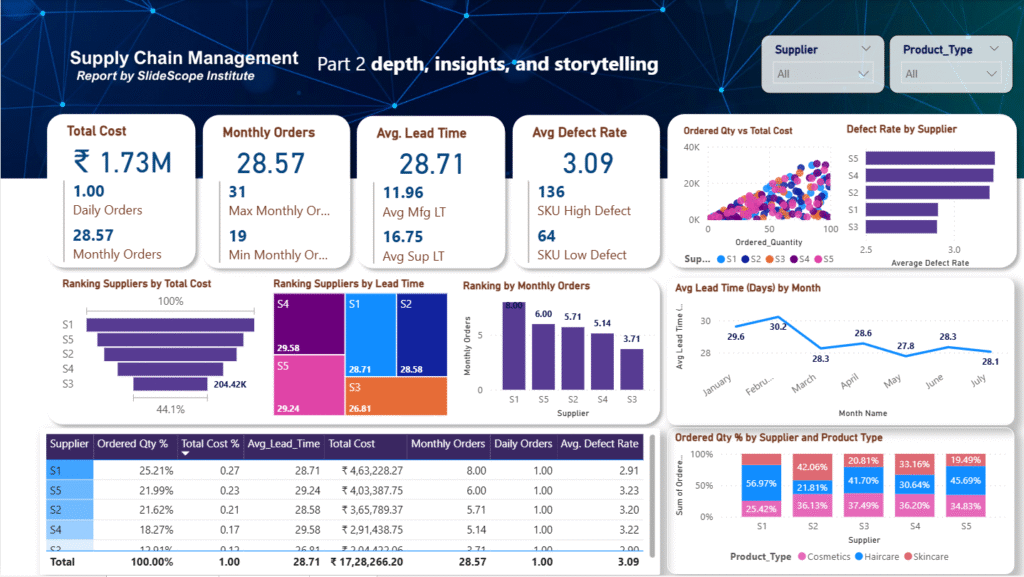
You already have strong core visuals. Now the goal is depth, insights, and storytelling, not clutter. Here is Part 1
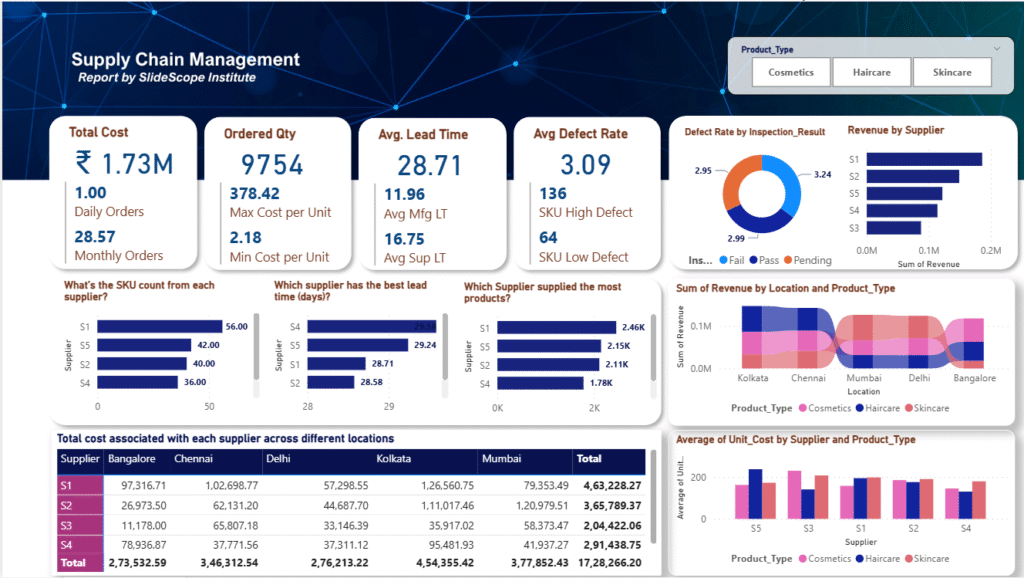
“I am excited to present this Supply Chain Management Dashboard, a practical and industry-aligned analytics solution designed to translate complex
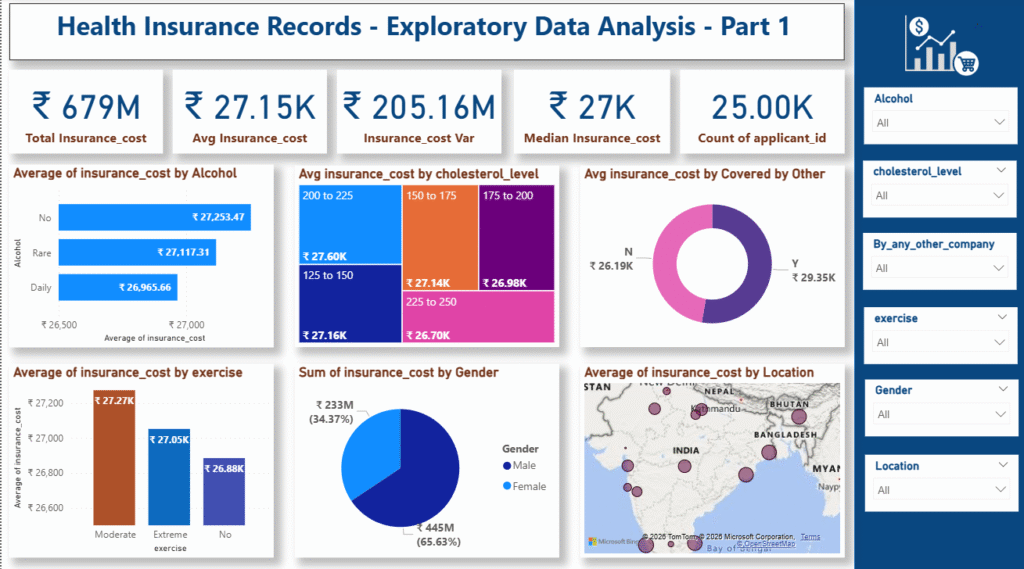
In today’s data-driven world, raw Excel files are no longer enough. Businesses, educators, and analysts need actionable insights, not just
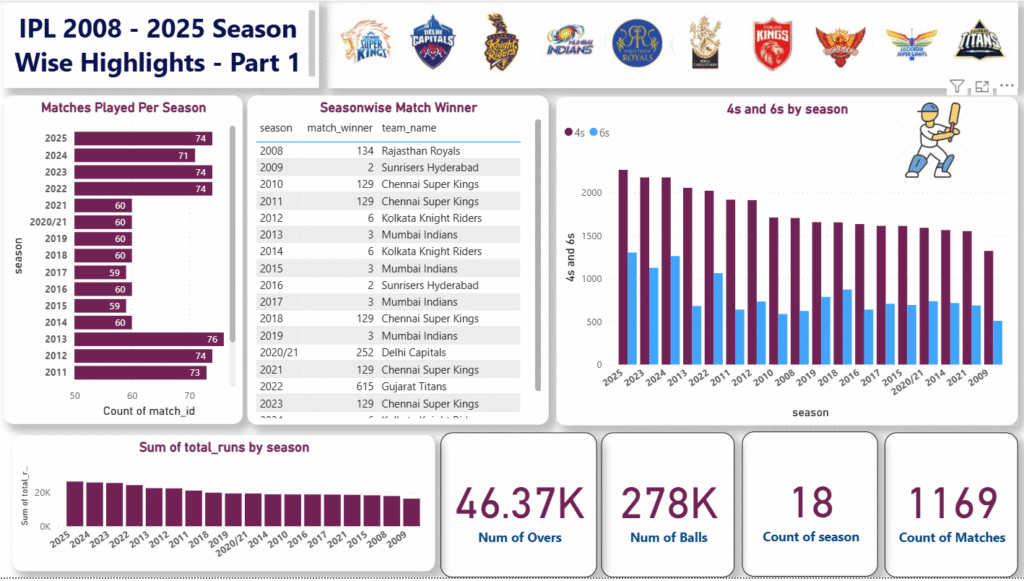
Below are DAX measures for bowler analytics, designed for our existing model that we created in First Part. These cover
Introduction When people talk about analytics dashboards, they usually jump straight to Power BI or Python. But over the years,