
- Pivot tables are used to generate table of statistics from a given table.
- It is a table where we put some summary from a given table. In this summary we can put sums, averages, count or other statistics, which the pivot table groups together in a meaningful way.
- Pivot tables are generally created by reshaping a table or transposition of a table.
- Pivot tables are helpful in Data Analysis and Visualization and is commonly used for report generation.
- In this chapter you will see transposition of data from multiple rows into columns of a single row. (MySql Example).
For example we will use the Northwind table in MySQL
Here is the sample code in MySQL
/*Query for Creating a Summary Table for Analysis of Month Wise freight for Different

years From Orders Table in Northwind Database.*/

-- select name, email, phone from users
SELECT year , SUM(CASE WHEN month = 1 THEN freight END) Jan_freight ,

SUM(CASE WHEN month = 2 THEN freight END) Feb_freight ,

SUM(CASE WHEN month = 3 THEN freight END) Mar_freight ,

SUM(CASE WHEN month = 4 THEN freight END) Apr_freight ,

SUM(CASE WHEN month = 5 THEN freight END) May_freight ,

SUM(CASE WHEN month = 6 THEN freight END) Jun_freight ,

SUM(CASE WHEN month = 7 THEN freight END) Jul_freight ,

SUM(CASE WHEN month = 8 THEN freight END) Aug_freight ,

SUM(CASE WHEN month = 9 THEN freight END) Sep_freight ,

SUM(CASE WHEN month = 10 THEN freight END) Oct_freight ,

SUM(CASE WHEN month = 11 THEN freight END) Nov_freight ,

SUM(CASE WHEN month = 12 THEN freight END) Dec_freight

FROM (SELECT orders.* , EXTRACT(YEAR FROM OrderDate) year ,

EXTRACT(MONTH FROM OrderDate) month FROM Orders ) Orders

GROUP BY year

ORDER BY year
— The EXTRACT() function extracts a part from a given date. Syntax.
— EXTRACT(part FROM date).
Sample Code for Python Pandas and MySQL Connection and Plotting Graph
import pandas as pd
import mysql.connector as sql
db_connection = sql.connect(host='localhost', database='northwindz', user='root', password='')
query = ''' SELECT year , SUM(CASE WHEN month = 1 THEN freight END) Jan_freight ,
SUM(CASE WHEN month = 2 THEN freight END) Feb_freight ,
SUM(CASE WHEN month = 3 THEN freight END) Mar_freight ,
SUM(CASE WHEN month = 4 THEN freight END) Apr_freight ,
SUM(CASE WHEN month = 5 THEN freight END) May_freight ,
SUM(CASE WHEN month = 6 THEN freight END) Jun_freight ,
SUM(CASE WHEN month = 7 THEN freight END) Jul_freight ,
SUM(CASE WHEN month = 8 THEN freight END) Aug_freight ,
SUM(CASE WHEN month = 9 THEN freight END) Sep_freight ,
SUM(CASE WHEN month = 10 THEN freight END) Oct_freight ,
SUM(CASE WHEN month = 11 THEN freight END) Nov_freight ,
SUM(CASE WHEN month = 12 THEN freight END) Dec_freight
FROM (SELECT orders.* , EXTRACT(YEAR FROM OrderDate) year ,
EXTRACT(MONTH FROM OrderDate) month FROM Orders ) Orders
GROUP BY year
ORDER BY year
'''
# read_sql(QUERY, CONNECTION)
data = pd.read_sql(query, db_connection)
data
data.fillna(0, inplace=True)
data
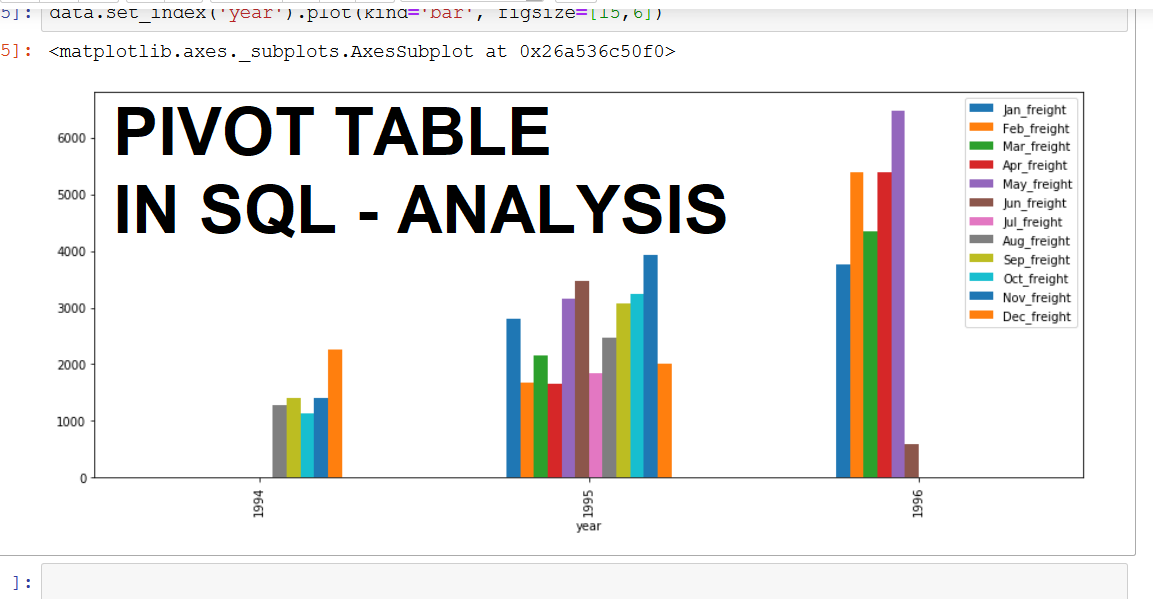
data.set_index('year')
data.set_index('year').plot(kind='bar', figsize=[15,6])
