
See the chart here:
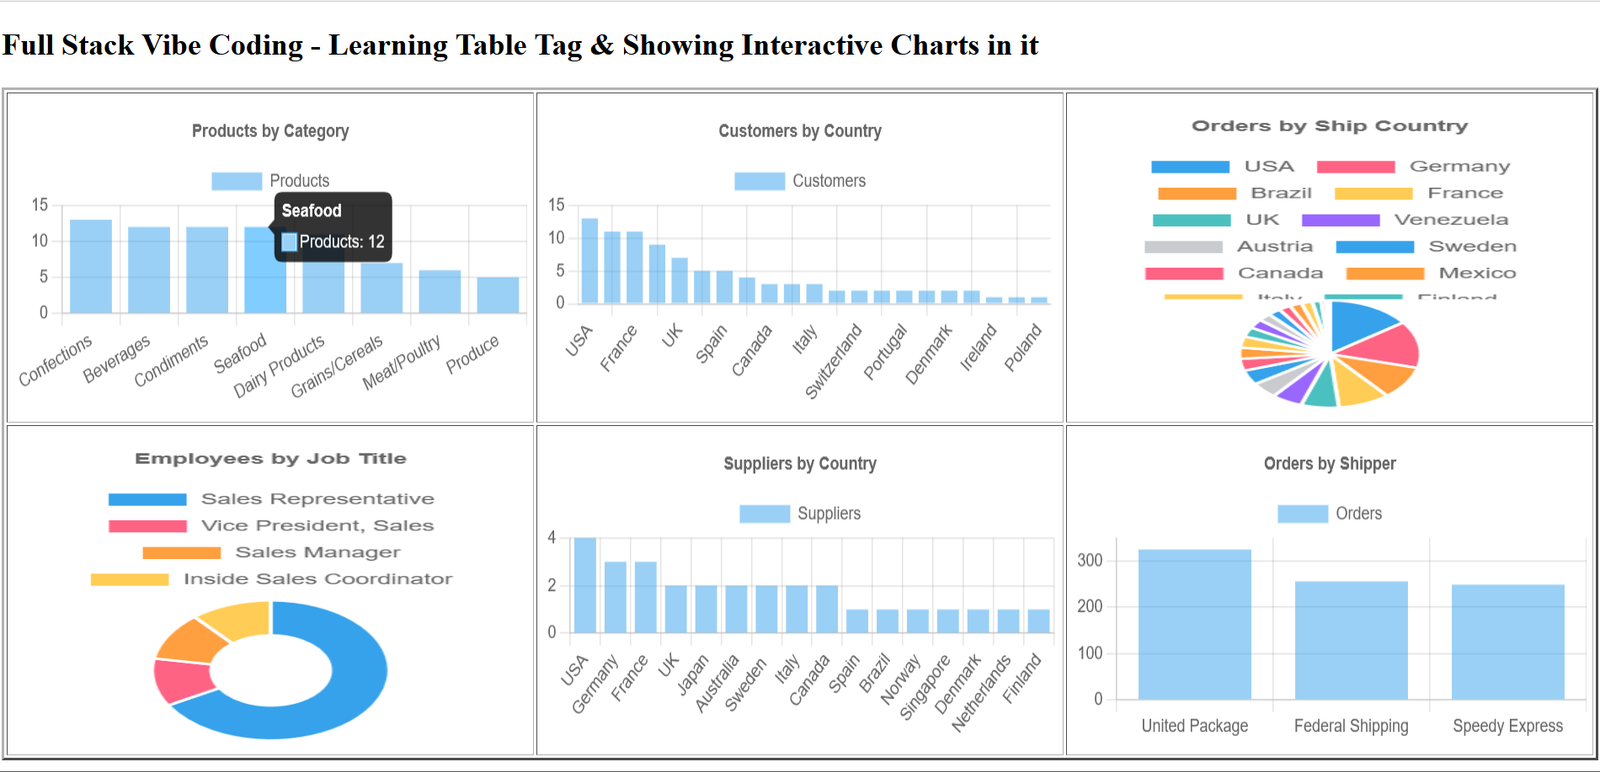
This chart may look ordinary but it has been created using: SQL Data -> Python API -> HTML Tables -> JS Populating Charts.JS
We studied the concept in our Previous Chapter: Read Data from APIs and Create Charts with JavaScript/. In this chapter we take it further and create an interactive dashboard with 6 visuals.
When I teach full stack development, I don’t want students to only memorize frameworks and syntax.
I want them to understand how data actually travels through an application.
So in this project, we are building something very simple but very useful.
We have the famous Northwind Traders database running in MySQL.
We will use Python to connect to that database and create a small API.
Then we will use JavaScript to call those APIs.
Finally, we will use Chart.js to convert the database information into interactive charts.
The final result is a dashboard containing six charts arranged in a simple HTML table.
The architecture looks like this:
MySQL Northwind Database
          ↓
       Python
          ↓
         API
          ↓
        JSON
          ↓
     JavaScript
          ↓
       Chart.js
          ↓
   HTML Canvas Charts
This is a great example of what I call full stack vibe coding because we can build the application step by step and immediately see how each piece connects to the next.
What We Are Building
Our final dashboard contains six visualizations.
┌────────────────────┬────────────────────┬────────────────────┐
│ Products Category  │ Customers Country  │ Orders Country     │
│       g1           │        g2          │       g3           │
├────────────────────┼────────────────────┼────────────────────┤
│ Employees Title    │ Suppliers Country  │ Orders Shipper     │
│       g4           │        g5          │       g6           │
└────────────────────┴────────────────────┴────────────────────┘
The six API endpoints will be:
/api/products
/api/customers
/api/orders
/api/employees
/api/suppliers
/api/shippers
Each API returns different information from the Northwind database.
Step 1, Connecting Python With MySQL
First, we need the MySQL connector for Python.
Install it using:
pip install mysql-connector-pythonNow we can create our Python backend.
The first function will connect to MySQL, execute a query and return the results.
import mysql.connector
import json
from http.server import HTTPServer, BaseHTTPRequestHandler


def get_data(query):

    db = mysql.connector.connect(
        host="localhost",
        user="root",
        password="mysql",
        database="northwind"
    )

    cursor = db.cursor(dictionary=True)

    cursor.execute(query)

    data = cursor.fetchall()

    cursor.close()
    db.close()

    return data
The important thing here is:
cursor = db.cursor(dictionary=True)Because we are using dictionary=True, every database row comes back as a Python dictionary.
For example:
{
    "CategoryName": "Beverages",
    "TotalProducts": 12
}
That structure is very convenient when we later convert the data into JSON.
Step 2, Creating the Python API
Now we create our HTTP server.
class API(BaseHTTPRequestHandler):

    def send_json(self, data):

        response = json.dumps(data, default=str)

        self.send_response(200)

        self.send_header(
            "Content-Type",
            "application/json"
        )

        self.send_header(
            "Access-Control-Allow-Origin",
            "*"
        )

        self.end_headers()

        self.wfile.write(response.encode())
The send_json() function takes our Python data and converts it into JSON.
This line:
json.dumps(data, default=str)converts the Python object into JSON text.
We also add:
Access-Control-Allow-Originbecause our frontend may be running from a different local port or location.
Step 3, Products API
Our first endpoint will return the number of products in each category.
if self.path == "/api/products":

    query = """
    SELECT
        c.CategoryName,
        COUNT(p.ProductID) AS TotalProducts

    FROM categories c

    JOIN products p
        ON c.CategoryID = p.CategoryID

    GROUP BY c.CategoryName

    ORDER BY TotalProducts DESC
    """
Here we are joining the categories and products tables.
The important SQL concept is:
COUNT()combined with:
GROUP BYInstead of returning every product, we are asking MySQL to calculate how many products belong to each category.
Step 4, Customers API
The second API groups customers by country.
elif self.path == "/api/customers":

    query = """
    SELECT
        Country,
        COUNT(*) AS TotalCustomers

    FROM customers

    GROUP BY Country

    ORDER BY TotalCustomers DESC
    """
The result might look like:
[
    {
        "Country": "USA",
        "TotalCustomers": 13
    },
    {
        "Country": "Germany",
        "TotalCustomers": 11
    }
]
This data is perfect for a bar chart.
Step 5, Orders API
For orders, we will count orders according to the shipping country.
elif self.path == "/api/orders":

    query = """
    SELECT
        ShipCountry,
        COUNT(OrderID) AS TotalOrders

    FROM orders

    GROUP BY ShipCountry

    ORDER BY TotalOrders DESC
    """
This is much more useful than simply doing:
SELECT * FROM ordersbecause charts generally need aggregated information.
Step 6, Employees API
Now let’s look at employees.
Instead of displaying every employee individually, we group them by job title.
elif self.path == "/api/employees":

    query = """
    SELECT
        Title,
        COUNT(EmployeeID) AS TotalEmployees

    FROM employees

    GROUP BY Title

    ORDER BY TotalEmployees DESC
    """
This information will be displayed using a doughnut chart.
Step 7, Suppliers API
Next, we count suppliers according to their country.
elif self.path == "/api/suppliers":

    query = """
    SELECT
        Country,
        COUNT(SupplierID) AS TotalSuppliers

    FROM suppliers

    GROUP BY Country

    ORDER BY TotalSuppliers DESC
    """
This will become our fifth visualization.
Step 8, Shippers API
Finally, we want to know how many orders were handled by each shipper.
elif self.path == "/api/shippers":

    query = """
    SELECT
        s.CompanyName,
        COUNT(o.OrderID) AS TotalOrders

    FROM shippers s

    JOIN orders o
        ON s.ShipperID = o.ShipVia

    GROUP BY s.ShipperID, s.CompanyName

    ORDER BY TotalOrders DESC
    """
Here we join the shippers table with the orders table.
Now the database can tell us how many orders each shipping company handled.
Complete Python API Code
Instead of putting all the individual pieces together manually, here is the complete backend code.
import mysql.connector
import json
from http.server import HTTPServer, BaseHTTPRequestHandler


def get_data(query):

    db = mysql.connector.connect(
        host="localhost",
        user="root",
        password="mysql",
        database="northwind"
    )

    cursor = db.cursor(dictionary=True)

    cursor.execute(query)

    data = cursor.fetchall()

    cursor.close()
    db.close()

    return data


class API(BaseHTTPRequestHandler):

    def send_json(self, data):

        response = json.dumps(data, default=str)

        self.send_response(200)

        self.send_header(
            "Content-Type",
            "application/json"
        )

        self.send_header(
            "Access-Control-Allow-Origin",
            "*"
        )

        self.end_headers()

        self.wfile.write(response.encode())


    def do_GET(self):

        if self.path == "/api/products":

            query = """
            SELECT
                c.CategoryName,
                COUNT(p.ProductID) AS TotalProducts

            FROM categories c

            JOIN products p
                ON c.CategoryID = p.CategoryID

            GROUP BY c.CategoryName

            ORDER BY TotalProducts DESC
            """


        elif self.path == "/api/customers":

            query = """
            SELECT
                Country,
                COUNT(*) AS TotalCustomers

            FROM customers

            GROUP BY Country

            ORDER BY TotalCustomers DESC
            """


        elif self.path == "/api/orders":

            query = """
            SELECT
                ShipCountry,
                COUNT(OrderID) AS TotalOrders

            FROM orders

            GROUP BY ShipCountry

            ORDER BY TotalOrders DESC
            """


        elif self.path == "/api/employees":

            query = """
            SELECT
                Title,
                COUNT(EmployeeID) AS TotalEmployees

            FROM employees

            GROUP BY Title

            ORDER BY TotalEmployees DESC
            """


        elif self.path == "/api/suppliers":

            query = """
            SELECT
                Country,
                COUNT(SupplierID) AS TotalSuppliers

            FROM suppliers

            GROUP BY Country

            ORDER BY TotalSuppliers DESC
            """


        elif self.path == "/api/shippers":

            query = """
            SELECT
                s.CompanyName,
                COUNT(o.OrderID) AS TotalOrders

            FROM shippers s

            JOIN orders o
                ON s.ShipperID = o.ShipVia

            GROUP BY s.ShipperID, s.CompanyName

            ORDER BY TotalOrders DESC
            """


        else:

            self.send_error(404)

            return


        try:

            data = get_data(query)

            self.send_json(data)

        except Exception as e:

            self.send_error(
                500,
                str(e)
            )


HTTPServer(
    ("localhost", 8000),
    API
).serve_forever()
Run it with:
python api.pyOur backend is now running on:
http://localhost:8000We can test an endpoint directly in the browser:
http://localhost:8000/api/productsIf everything is working, we should see JSON data.
Step 9, Creating the HTML Dashboard
Now we move to the frontend.
Our HTML is intentionally simple.
<table border="2" width="100%">

    <tr>

        <td>
            <canvas id="g1"></canvas>
        </td>

        <td>
            <canvas id="g2"></canvas>
        </td>

        <td>
            <canvas id="g3"></canvas>
        </td>

    </tr>

    <tr>

        <td>
            <canvas id="g4"></canvas>
        </td>

        <td>
            <canvas id="g5"></canvas>
        </td>

        <td>
            <canvas id="g6"></canvas>
        </td>

    </tr>

</table>
Each canvas represents one chart.
Step 10, Making the Canvases Equal
To make the dashboard look clean, we use CSS.
<style>

table {
    width: 100%;
    table-layout: fixed;
}

td {
    width: 33.33%;
    height: 300px;
    padding: 10px;
}

canvas {
    width: 100% !important;
    height: 280px !important;
}

</style>
Now all six chart areas have a consistent size.
Step 11, Adding Chart.js
We need Chart.js to create the actual visualizations.
<script src="https://cdn.jsdelivr.net/npm/chart.js"></script>Now JavaScript can create charts inside our canvas elements.
Step 12, Fetching Data From Python
We create a common function for communicating with our API.
const API = "http://localhost:8000";


async function getData(url) {

    const response = await fetch(API + url);

    if (!response.ok) {

        throw new Error(
            "API Error: " + response.status
        );

    }

    return await response.json();
}
Now we can simply call:
getData("/api/products")and receive the data from Python.
Step 13, Creating the Six Charts
Here is the complete JavaScript.
async function chartProducts() {

    const data = await getData("/api/products");

    const labels = data.map(
        item => item.CategoryName
    );

    const values = data.map(
        item => Number(item.TotalProducts)
    );

    new Chart(
        document.getElementById("g1"),
        {
            type: "bar",

            data: {

                labels: labels,

                datasets: [
                    {
                        label: "Products",
                        data: values
                    }
                ]
            },

            options: {

                responsive: true,

                plugins: {

                    title: {
                        display: true,
                        text: "Products by Category"
                    }

                }

            }
        }
    );
}


async function chartCustomers() {

    const data = await getData("/api/customers");

    const labels = data.map(
        item => item.Country
    );

    const values = data.map(
        item => Number(item.TotalCustomers)
    );

    new Chart(
        document.getElementById("g2"),
        {
            type: "bar",

            data: {

                labels: labels,

                datasets: [
                    {
                        label: "Customers",
                        data: values
                    }
                ]
            },

            options: {

                responsive: true,

                plugins: {

                    title: {
                        display: true,
                        text: "Customers by Country"
                    }

                }

            }
        }
    );
}


async function chartOrders() {

    const data = await getData("/api/orders");

    const labels = data.map(
        item => item.ShipCountry
    );

    const values = data.map(
        item => Number(item.TotalOrders)
    );

    new Chart(
        document.getElementById("g3"),
        {
            type: "pie",

            data: {

                labels: labels,

                datasets: [
                    {
                        label: "Orders",
                        data: values
                    }
                ]
            },

            options: {

                responsive: true,

                plugins: {

                    title: {
                        display: true,
                        text: "Orders by Ship Country"
                    }

                }

            }
        }
    );
}


async function chartEmployees() {

    const data = await getData("/api/employees");

    const labels = data.map(
        item => item.Title
    );

    const values = data.map(
        item => Number(item.TotalEmployees)
    );

    new Chart(
        document.getElementById("g4"),
        {
            type: "doughnut",

            data: {

                labels: labels,

                datasets: [
                    {
                        label: "Employees",
                        data: values
                    }
                ]
            },

            options: {

                responsive: true,

                plugins: {

                    title: {
                        display: true,
                        text: "Employees by Job Title"
                    }

                }

            }
        }
    );
}


async function chartSuppliers() {

    const data = await getData("/api/suppliers");

    const labels = data.map(
        item => item.Country
    );

    const values = data.map(
        item => Number(item.TotalSuppliers)
    );

    new Chart(
        document.getElementById("g5"),
        {
            type: "bar",

            data: {

                labels: labels,

                datasets: [
                    {
                        label: "Suppliers",
                        data: values
                    }
                ]
            },

            options: {

                responsive: true,

                plugins: {

                    title: {
                        display: true,
                        text: "Suppliers by Country"
                    }

                }

            }
        }
    );
}


async function chartShippers() {

    const data = await getData("/api/shippers");

    const labels = data.map(
        item => item.CompanyName
    );

    const values = data.map(
        item => Number(item.TotalOrders)
    );

    new Chart(
        document.getElementById("g6"),
        {
            type: "bar",

            data: {

                labels: labels,

                datasets: [
                    {
                        label: "Orders",
                        data: values
                    }
                ]
            },

            options: {

                responsive: true,

                plugins: {

                    title: {
                        display: true,
                        text: "Orders by Shipper"
                    }

                }

            }
        }
    );
}
Finally, we call all six functions:
chartProducts();
chartCustomers();
chartOrders();
chartEmployees();
chartSuppliers();
chartShippers();
Complete Frontend Code
So if you want to keep the frontend in a single index.html file, the complete structure is:
<!DOCTYPE html>

<html>

<head>

    <title>
        Northwind Interactive Dashboard
    </title>

    <script src="https://cdn.jsdelivr.net/npm/chart.js"></script>

    <style>

        table {
            width: 100%;
            table-layout: fixed;
        }

        td {
            width: 33.33%;
            height: 300px;
            padding: 10px;
        }

        canvas {
            width: 100% !important;
            height: 280px !important;
        }

    </style>

</head>


<body>

    <h1>
        Northwind Interactive Dashboard
    </h1>


    <table border="2">

        <tr>

            <td>
                <canvas id="g1"></canvas>
            </td>

            <td>
                <canvas id="g2"></canvas>
            </td>

            <td>
                <canvas id="g3"></canvas>
            </td>

        </tr>


        <tr>

            <td>
                <canvas id="g4"></canvas>
            </td>

            <td>
                <canvas id="g5"></canvas>
            </td>

            <td>
                <canvas id="g6"></canvas>
            </td>

        </tr>

    </table>


<script>

const API = "http://localhost:8000";


async function getData(url) {

    const response = await fetch(API + url);

    if (!response.ok) {
        throw new Error(
            "API Error: " + response.status
        );
    }

    return await response.json();
}


async function chartProducts() {

    const data = await getData("/api/products");

    new Chart(
        document.getElementById("g1"),
        {
            type: "bar",

            data: {

                labels: data.map(
                    item => item.CategoryName
                ),

                datasets: [
                    {
                        label: "Products",

                        data: data.map(
                            item => Number(item.TotalProducts)
                        )
                    }
                ]
            },

            options: {

                responsive: true,

                plugins: {
                    title: {
                        display: true,
                        text: "Products by Category"
                    }
                }
            }
        }
    );
}


async function chartCustomers() {

    const data = await getData("/api/customers");

    new Chart(
        document.getElementById("g2"),
        {
            type: "bar",

            data: {

                labels: data.map(
                    item => item.Country
                ),

                datasets: [
                    {
                        label: "Customers",

                        data: data.map(
                            item => Number(item.TotalCustomers)
                        )
                    }
                ]
            },

            options: {

                responsive: true,

                plugins: {
                    title: {
                        display: true,
                        text: "Customers by Country"
                    }
                }
            }
        }
    );
}


async function chartOrders() {

    const data = await getData("/api/orders");

    new Chart(
        document.getElementById("g3"),
        {
            type: "pie",

            data: {

                labels: data.map(
                    item => item.ShipCountry
                ),

                datasets: [
                    {
                        label: "Orders",

                        data: data.map(
                            item => Number(item.TotalOrders)
                        )
                    }
                ]
            },

            options: {

                responsive: true,

                plugins: {
                    title: {
                        display: true,
                        text: "Orders by Ship Country"
                    }
                }
            }
        }
    );
}


async function chartEmployees() {

    const data = await getData("/api/employees");

    new Chart(
        document.getElementById("g4"),
        {
            type: "doughnut",

            data: {

                labels: data.map(
                    item => item.Title
                ),

                datasets: [
                    {
                        label: "Employees",

                        data: data.map(
                            item => Number(item.TotalEmployees)
                        )
                    }
                ]
            },

            options: {

                responsive: true,

                plugins: {
                    title: {
                        display: true,
                        text: "Employees by Job Title"
                    }
                }
            }
        }
    );
}


async function chartSuppliers() {

    const data = await getData("/api/suppliers");

    new Chart(
        document.getElementById("g5"),
        {
            type: "bar",

            data: {

                labels: data.map(
                    item => item.Country
                ),

                datasets: [
                    {
                        label: "Suppliers",

                        data: data.map(
                            item => Number(item.TotalSuppliers)
                        )
                    }
                ]
            },

            options: {

                responsive: true,

                plugins: {
                    title: {
                        display: true,
                        text: "Suppliers by Country"
                    }
                }
            }
        }
    );
}


async function chartShippers() {

    const data = await getData("/api/shippers");

    new Chart(
        document.getElementById("g6"),
        {
            type: "bar",

            data: {

                labels: data.map(
                    item => item.CompanyName
                ),

                datasets: [
                    {
                        label: "Orders",

                        data: data.map(
                            item => Number(item.TotalOrders)
                        )
                    }
                ]
            },

            options: {

                responsive: true,

                plugins: {
                    title: {
                        display: true,
                        text: "Orders by Shipper"
                    }
                }
            }
        }
    );
}


chartProducts();
chartCustomers();
chartOrders();
chartEmployees();
chartSuppliers();
chartShippers();

</script>

</body>

</html>
Understanding What We Actually Built
Now let’s look at the complete flow again.
When the webpage loads, JavaScript runs:
chartProducts();That function calls:
getData("/api/products");The browser sends a request to Python.
Python receives:
/api/productsIt executes the SQL query.
MySQL returns the aggregated data.
Python converts that data to JSON.
The browser receives the JSON.
JavaScript extracts the labels and values.
Chart.js creates the chart inside:
<canvas id="g1"></canvas>The exact same process happens for g2, g3, g4, g5 and g6.
That is the complete full stack connection.
Why This Project Is Useful
This project may look like a simple chart dashboard, but it covers several important development concepts.
We are using:
MySQL for data storage.
SQL for querying and aggregating information.
Python for backend processing.
HTTP for communication.
REST-style API endpoints for exposing data.
JSON for transferring information.
JavaScript for frontend logic.
Chart.js for visualization.
HTML Canvas for rendering charts.
CSS for dashboard layout.
That’s a lot of full stack concepts inside one relatively small project.
And this is exactly why I like building projects this way.
Rather than learning each technology separately, we can see how they work together.
The final result shown in this project is a six-chart interactive Northwind dashboard, but the same architecture can eventually become a much larger application.
We could add authentication, filters, date ranges, sales KPIs, product-level analysis, customer segmentation, revenue calculations and many other features.
But the foundation would remain the same:
Database → Backend → API → Frontend → Visualization.
That’s the real lesson behind this project.
Conclusion
For me, the biggest advantage of a project like this is that it removes the mystery from full stack development.
Instead of simply saying that the frontend communicates with the backend, we can actually watch it happen.
Instead of saying that APIs return JSON, we can open the endpoint and see the JSON.
Instead of saying that JavaScript consumes an API, we can look at the fetch() function.
And instead of saying that data visualization is connected to a database, we can follow the data from a MySQL table all the way to a chart on the screen.
The final dashboard is therefore not just six charts.
It is a visual demonstration of the complete data journey.
MySQL stores the information.
Python retrieves and processes it.
The API exposes it.
JSON transfers it.
JavaScript receives it.
Chart.js visualizes it.
And the HTML canvas gives the visualization a place to appear.
That is what makes this a useful full stack learning project.
And once you understand this small application, you can start replacing individual pieces with more advanced technologies without losing sight of what is happening underneath.
You can replace the basic Python HTTP server with Flask or FastAPI.
You can move from a simple HTML page to React.
You can introduce authentication.
You can add more complex SQL queries.
You can build filters and dynamic dashboards.
But the fundamental architecture remains familiar.
For someone learning full stack development, that understanding is far more valuable than simply copying a framework-based project.
Disclaimer: This project is created for educational and demonstration purposes. The Northwind database is used as a sample relational database, and the Python HTTP server shown here is intentionally simple for learning. A production application would require stronger security, validation, authentication, error handling, database connection management and other production considerations.