
Mobile App User Engagement Dashboard using Power BI & Python
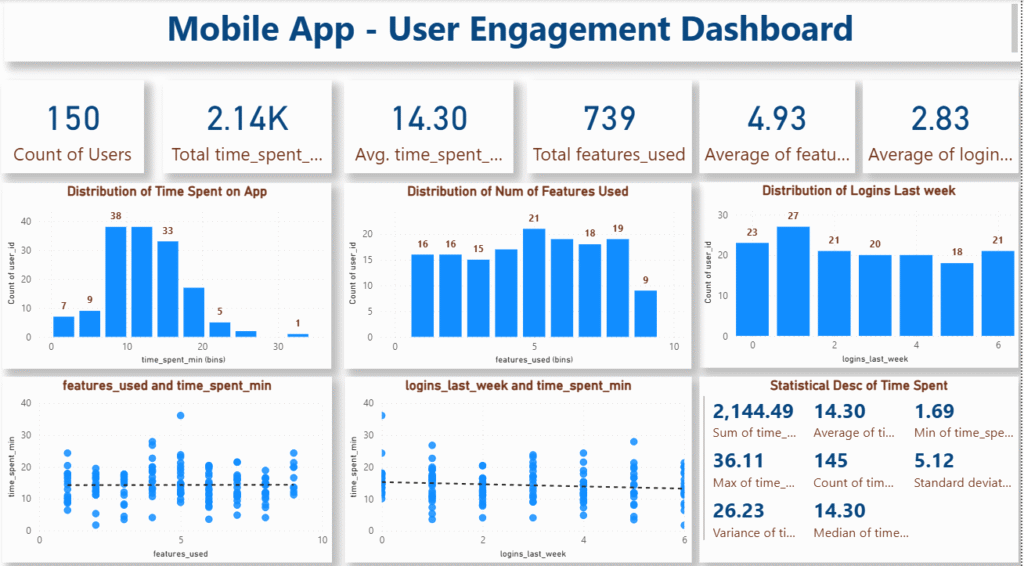
A Complete Step-by-Step TutorialBy Ankit Srivastava Building a user engagement dashboard is one of the most practical exercises for any […]
A Complete Step-by-Step TutorialBy Ankit Srivastava Building a user engagement dashboard is one of the most practical exercises for any […]
Our model that we create in Part 1 of this project, is already strong enough to calculate batsman performance accurately.
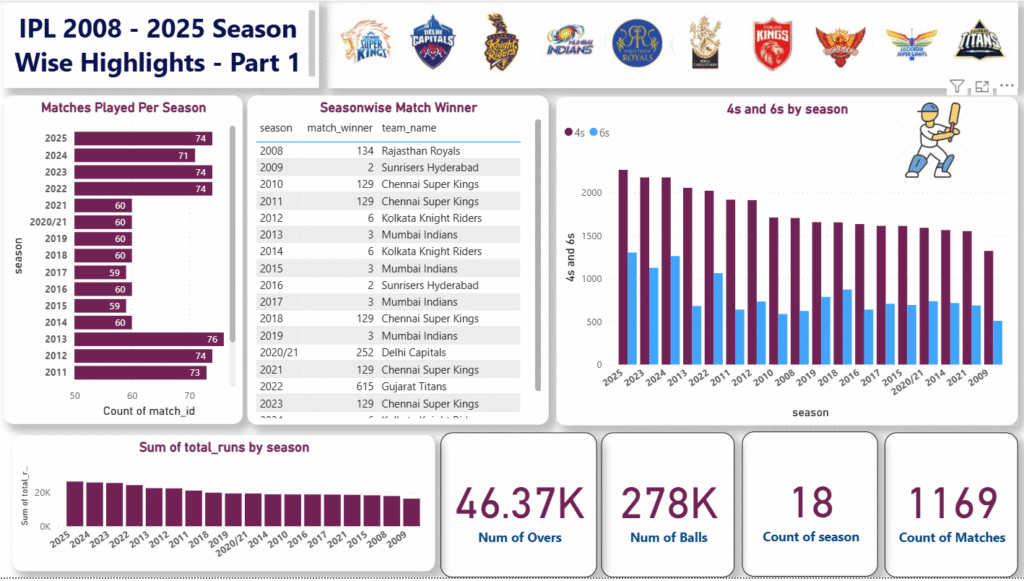
The Indian Premier League (IPL) is more than just a cricket tournament—it’s a goldmine of data, trends, and performance insights.
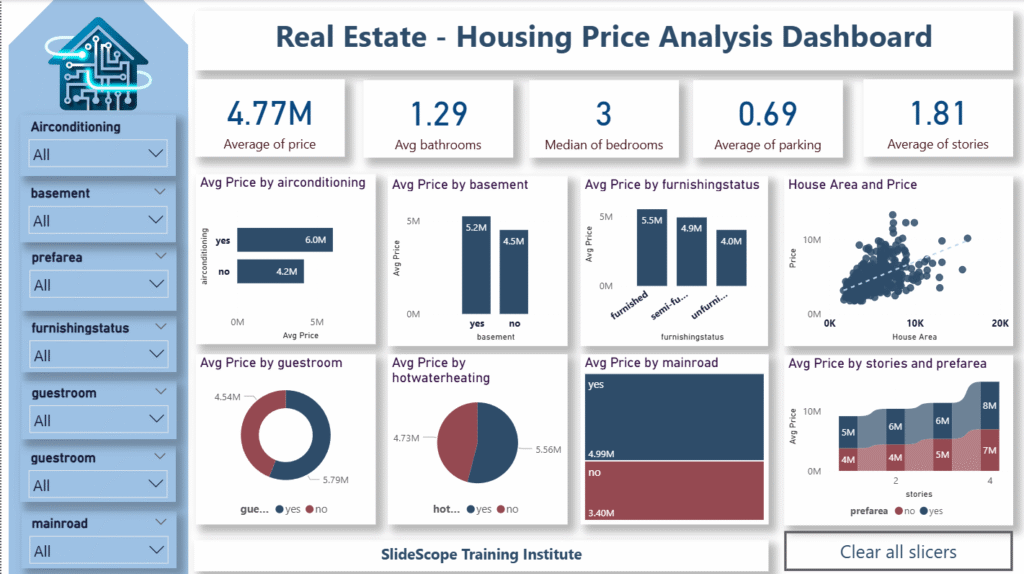
By Ankit Srivastava Understanding real estate pricing is one of the most important analytical skills today. Whether you’re a data
A Practical, Analytics-Driven Guide for Students, Professionals & Data Enthusiasts Download Dataset Here As someone who has spent over a
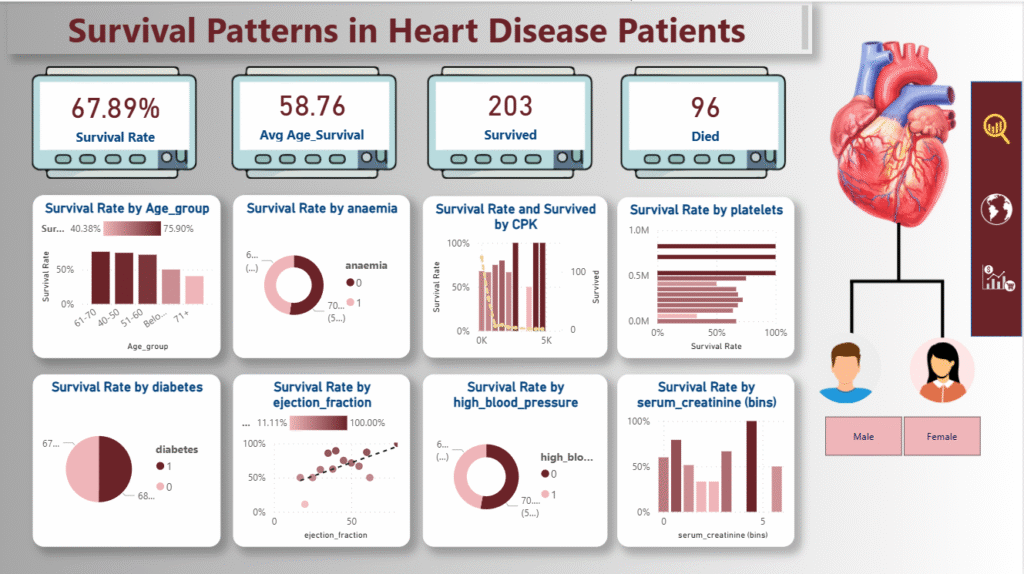
By Ankit Srivastava – Data Analyst & BI Consultant Data visualization can turn complex medical data into life-saving insights. In
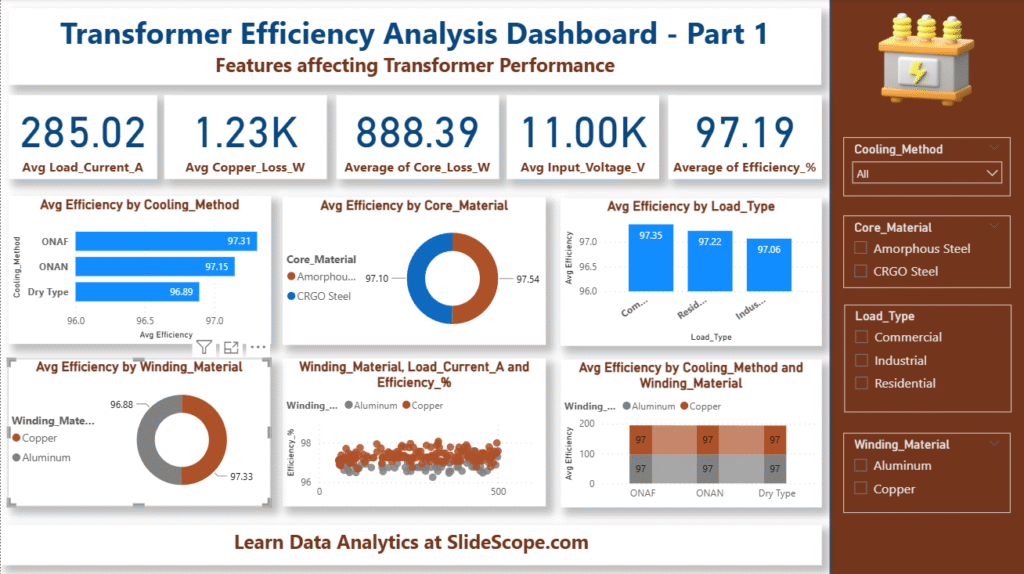
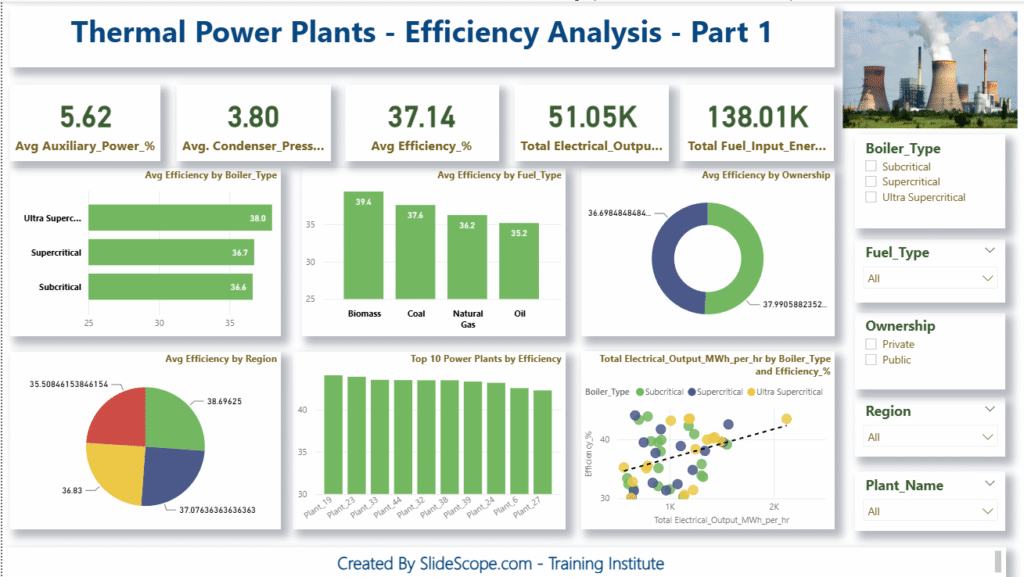
By Ankit Srivastava | Data Analytics & Visualization Expert Introduction Transformers are at the heart of every power distribution system.
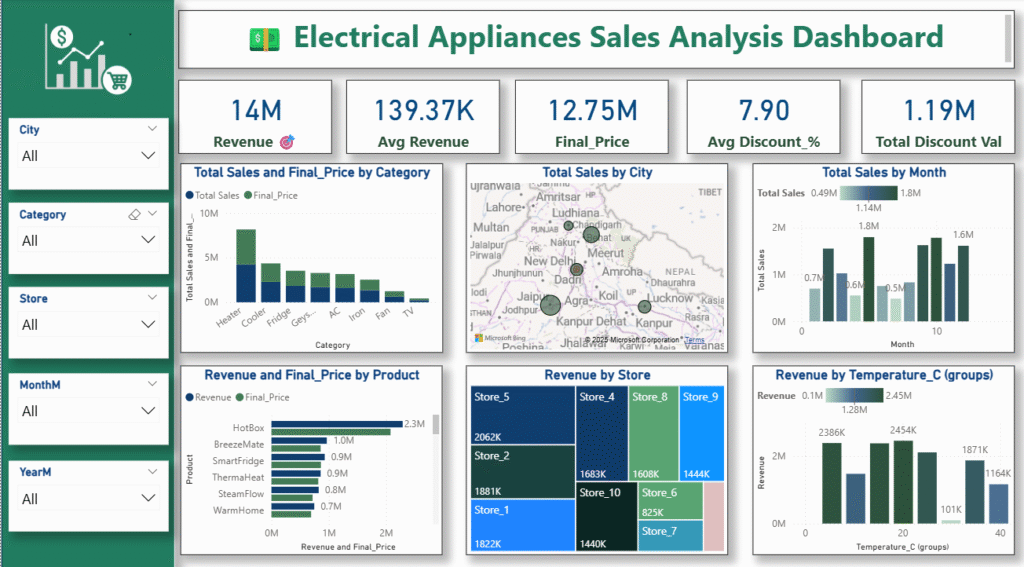
By Ankit Srivastava If you’ve ever wanted to analyze your business data visually — from total revenue to city-wise performance
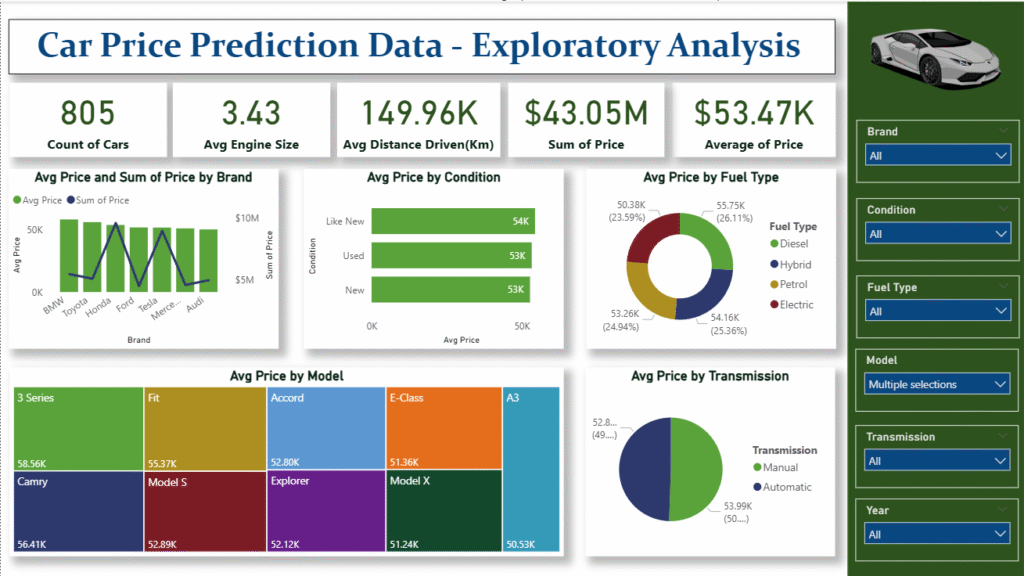
As data professionals, we often face one common challenge — understanding the story behind the data before building predictive models.
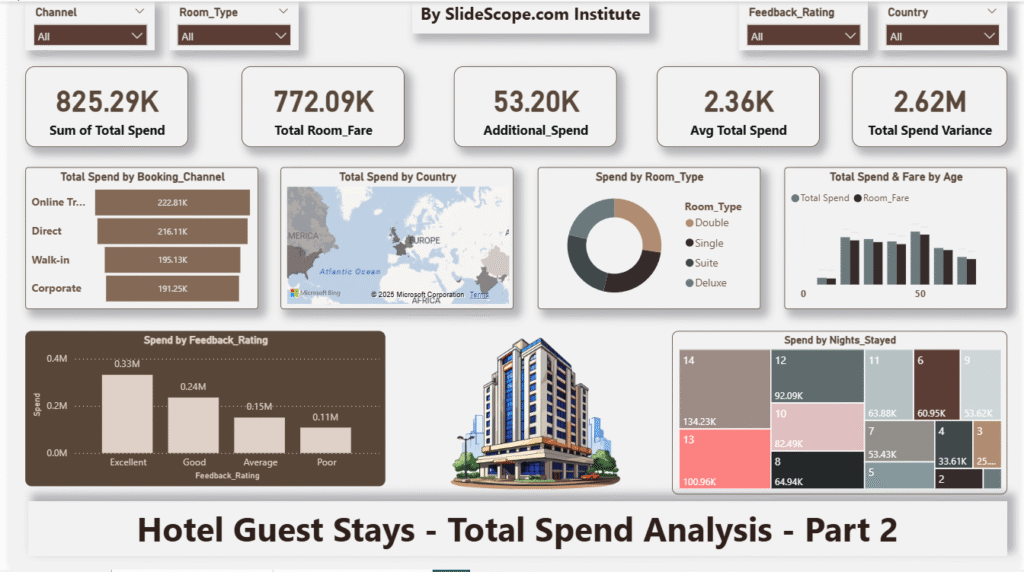
By Ankit Srivastava | Data Analytics & Power BI Instructor | SlideScope.com Institute Welcome back to Part 2 of our