
HR Analytics dataset with Practice Questions & Solutions – Power BI, Tableau or Python Pandas
Here’s a complete HR dataset for you in CSV format (with 300 rows), along with a list of business questions/problems […]
Here’s a complete HR dataset for you in CSV format (with 300 rows), along with a list of business questions/problems […]

Honey production dataset in the USA for the year 1998. Here’s a quick summary of the columns and their meanings

Welcome to this Power BI tutorial on the Smart Agriculture Analytics Dashboard, where we transform raw farm data into actionable
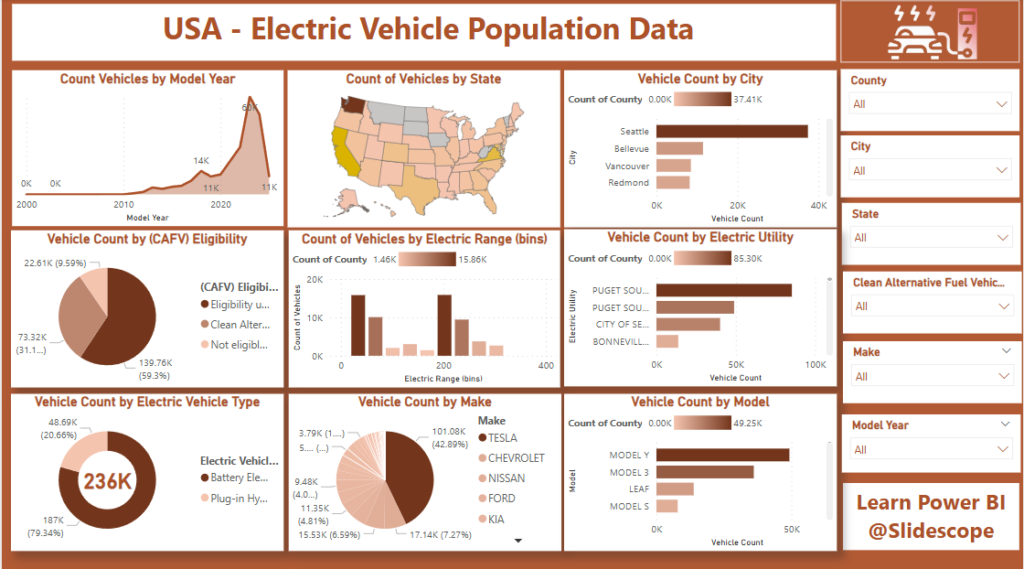
1. Dashboard Layout Design Dataset Link : https://www.kaggle.com/datasets/ricardobj/electric-vehicle-population Note: We don’t own the link, it belongs the user who has

The Zillow Home Value Index (ZHVI) is a metric created by Zillow to track the typical home value in a

User Question on our Youtube channel: I have a question on attrition rate – for e.g. we have employees who

Dataset Link : https://www.kaggle.com/datasets/samruddhi4040/online-sales-data?select=Details.csv This Power BI dashboard presents a detailed analysis of responses from data professionals. It’s a great
📊 What You’ll Learn: 📈 How to analyze year-over-year Sales, Profit, Orders, and Returns growth 🌍 Region-wise performance breakdown: West,

Here’s an overview of the North America Retail Supply Chain & Sales Analysis Dashboard based on the image you provided:
ContextThe Sustainable Development Report (SDR) tracks annual progress on the Sustainable Development Goals (SDGs), adopted by all 193 UN Member