

Power BI Tutorial: Global Advertising Spend Dashboard Explanation (2000–2024 + Forecast to 2034)
This Power BI dashboard provides a comprehensive view of advertising spending trends globally from the year 2000 to 2024, along […]
This Power BI dashboard provides a comprehensive view of advertising spending trends globally from the year 2000 to 2024, along […]

This is Part 4 Of the IPL Data Analysis project. In this part you will learn important questions that will

The data spans from September 2023 to September 2024, offering a comprehensive look at how Italy’s rental landscape is evolving.

In this tutorial you will learn SQL commands to Join 6 Tables together and then answer the data analysis questions.

Dataset we are using in this tutorial is Northwind Sample Superstore Dataset Question: How many products are there in each
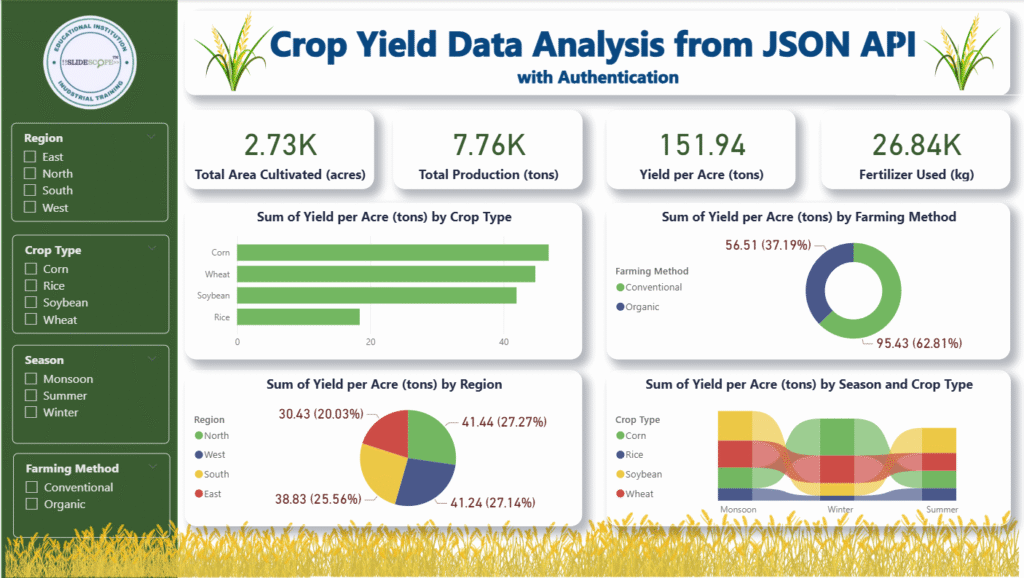
This Power BI dashboard titled “Crop Yield Data Analysis from JSON API with Authentication” showcases agricultural insights derived from a
This dataset contains 200 rows of simulated records representing book borrowing transactions across multiple public library branches. It captures both

✅ Here is the code to remove Background from Images using Rembg library ✅ Notes: 💡 Tip: If you get

With the help of Data Engineering Team of Slidescope we have created this API Here is the Dataset Overview: Farm
Q1: Player participation trend by season Season =LOOKUPVALUE(matches[season], matches[id], deliveries[match_id])This adds a Season column inside the deliveries table, eliminating lookup