

Power BI Dashboard Tutorial: Product Retail Prices in Canadian Provinces
This Power BI dashboard presents a comprehensive analysis of retail prices of products across various Canadian provinces, incorporating tax implications, […]
This Power BI dashboard presents a comprehensive analysis of retail prices of products across various Canadian provinces, incorporating tax implications, […]
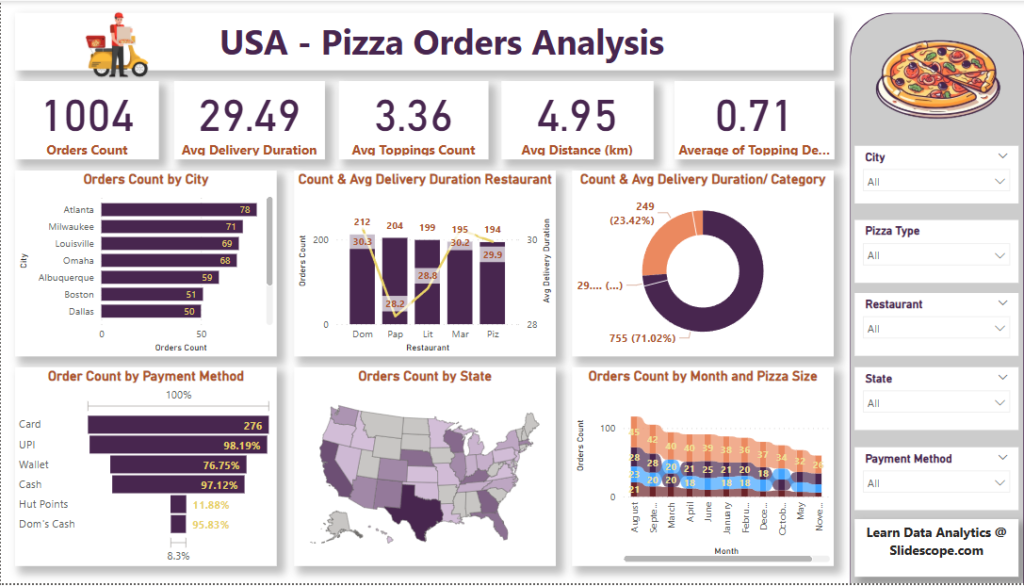
This is a Power BI dashboard titled “USA – Pizza Orders Analysis”, and it presents a comprehensive overview of pizza
Here are solutions for the DAX Questions for Solar Panel Sales Dataset (2024-2025) ⚡ DAX Formulas for Solar Panel Sales
For Power BI and DAX Practice 📘 Dataset Column Descriptions: Column Name Description Sale Date The date when the solar

🎯 Objective To track and analyze the performance of call center agents, call handling efficiency, customer satisfaction, and topic-wise issue

We will learn practical usage of following operators in Power BI Arithmetic operatorComparison operatorsText concatenation operatorLogical operators Here are DAX

📄 Dataset Description: Electrical Appliances Sales vs Temperature This dataset contains 100 records of synthetic sales data for various electrical
Dataset: https://github.com/slidescope/data/blob/master/DAX_Count_Functions_Demo.csv Here are example DAX formulas using the dataset for understanding COUNT, COUNTA, COUNTX, and COUNTAX in Power BI:
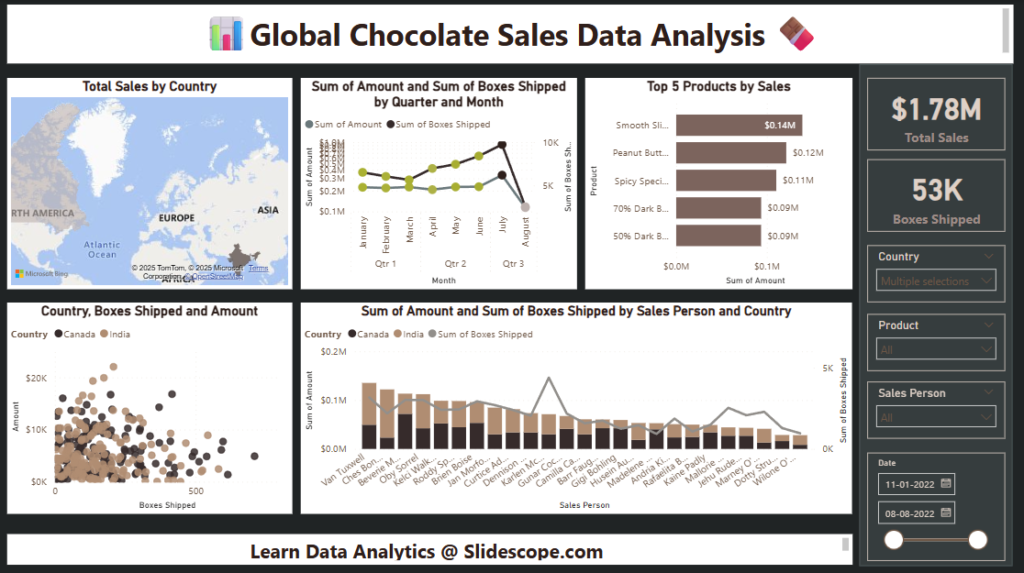
Unwrap Powerful Insights from Sweet Data! Dataset Overview:Dive into a rich dataset capturing the complete sales lifecycle of chocolate products.

📊 Dashboard IdeasSales Performance Overview Total Sales, Total Profit, Total Quantity (cards or KPI tiles) Profit by Product Category/Sub-Category (bar/column