Powered by Slidescope
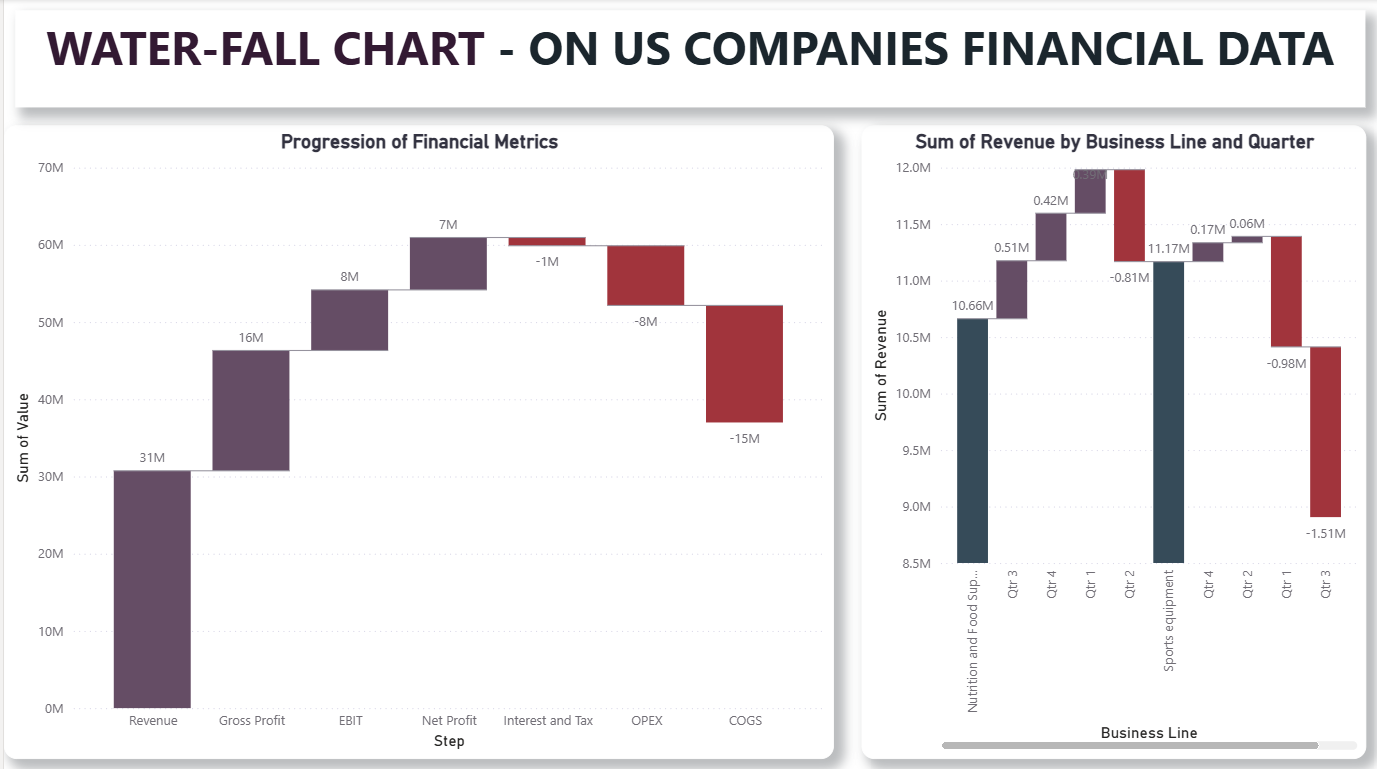
Understanding Waterfall Charts in Power BI: Perfect for Running Totals
Your email address will not be published. Required fields are marked *
Comment *
Name*
Email*
Website
Save my name, email, and website in this browser for the next time I comment.