
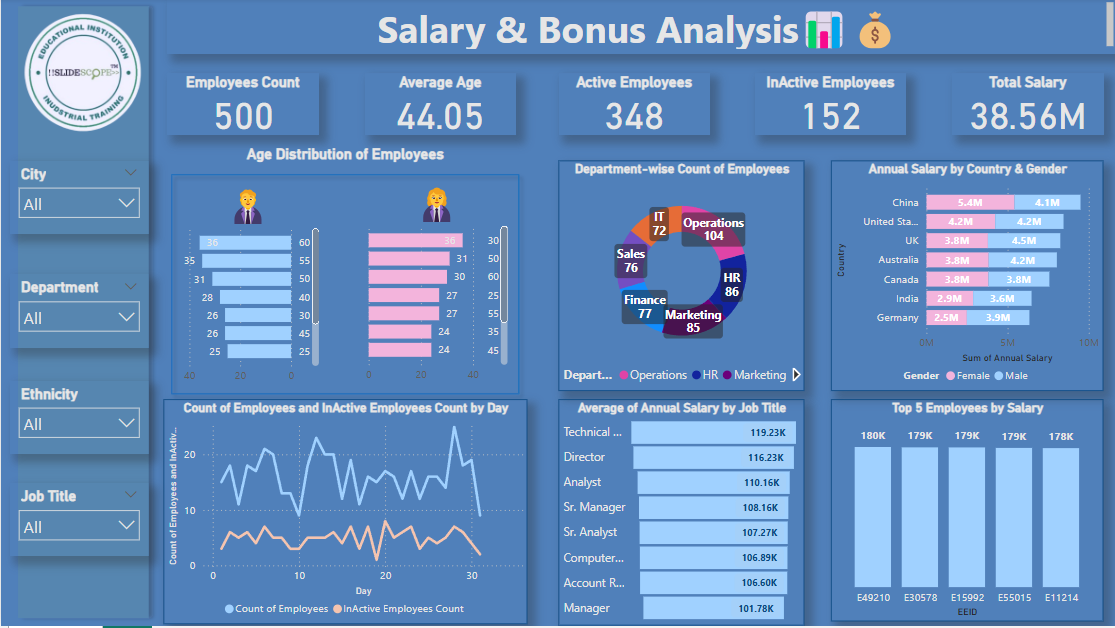
This dashboard provides an analysis of salary and bonus data for employees across various departments, job titles, and locations. Here’s a breakdown of the key insights displayed:
Top Summary Metrics:
- Employees Count: 500 total employees.
- Average Age: 44.05 years.
- Active Employees: 348.
- Inactive Employees: 152.
- Total Salary: 38.56 million.
Dataset : https://github.com/slidescope/Salary-and-Bonus-Analysis-Dashboard-in-Power-BI/
Filters on the Left:
Users can filter data based on:
- City
- Department
- Ethnicity
- Job Title
Key Visualizations:
- Age Distribution of Employees:
- Displays the number of employees by age groups for males and females separately.
- Department-wise Count of Employees:
- Shows the distribution of employees across departments, including IT, Operations, HR, Marketing, Finance, and Sales.
- Annual Salary by Country & Gender:
- A bar chart comparing male and female salaries across different countries (e.g., China, US, UK, Australia, Canada, India, and Germany).
- Count of Employees & Inactive Employees by Day:
- A time-series line chart showing daily employee count trends, including active and inactive employees.
- Average Annual Salary by Job Title:
- A ranked list of average salaries for different job roles such as Technical, Director, Analyst, Sr. Manager, and more.
- Top 5 Employees by Salary:
- A bar chart displaying the top 5 employees with the highest salaries, identified by employee IDs.
Conclusion:
This dashboard is useful for HR and management teams to analyze employee distribution, salary trends, and workforce activity. It provides insights into gender salary gaps, department workforce allocation, and salary distribution by job role and country.