What we do

Electrical-consulting

We are experts in Solar Power Plants Consulting and EPC. We have 10+ Years of experience in installing and commissioning of Solar Power Plants.

Our IT Team is expert in Software Development, Web Development, Data Analytics and Digital Marketing. We have handled 200+ IT Projects successfully.

Our team provides hands on training on Data Science, Data Analytics, Full Stack Development, Digital Marketing and Graphics Designing

Power BI Tutorials and Articles

IPL 2008-2025 – Bowlers Performance Dashboard – Part 4 – Power BI

Below are DAX measures for bowler analytics, designed for our existing model that we created in First Part. These cover...

Student Performance Analysis in Excel: Step-by-Step Guide to Build an Interactive EDA Dashboard

Introduction When people talk about analytics dashboards, they usually jump straight to Power BI or Python. But over the years...

Mobile App User Engagement Dashboard using Power BI & Python

A Complete Step-by-Step TutorialBy Ankit Srivastava Building a user engagement dashboard is one of the most practical exercises for any...

IPL 2008-2025 – Batsman Performance Dashboard – Part 3 – Power BI

Our model that we create in Part 1 of this project, is already strong enough to calculate batsman performance accurately...

IPL 2008 – 2025 Season Wise Highlights – Part 1 | Power BI Tutorial

The Indian Premier League (IPL) is more than just a cricket tournament—it’s a goldmine of data, trends, and performance insights...

Power BI Tutorial – Real Estate Housing Price Analysis (Complete Guide)

By Ankit Srivastava Understanding real estate pricing is one of the most important analytical skills today. Whether you’re a data...

Power BI Tutorial – Building a Thermal Power Plant Efficiency Dashboard (By Ankit Srivastava)

A Practical, Analytics-Driven Guide for Students, Professionals & Data Enthusiasts Download Dataset Here As someone who has spent over a...

Power BI Tutorial: Analyzing Survival Patterns in Heart Disease Patients

By Ankit Srivastava – Data Analyst & BI Consultant Data visualization can turn complex medical data into life-saving insights. In...

Excel Tutorials

Excel Dashboard Tutorial – Fitness & Health Tracking Data – Interactive Report

I’m Ankit Srivastava. I built this Fitness & Health Tracking — Exploratory Data Analysis (EDA) dashboard in Excel to quickly...

Excel Shoe Store Sales Analysis Dashboard

This is an Sales Analysis Dashboard created in Excel, visually representing sales data using various charts and filters. Below is...

Generative AI Projects

No posts found.

Python Pandas Tutorial

How to Run Jupyter Notebooks and Generate HTML Reports with Python Scripts

Here’s a simple guide on running Jupyter Notebooks and generating HTML reports using Python scripts. We’ll use the popular nbconvert...

Analysis of Football Match Statistics Data of 25 Years – Python Pandas

Get code here : https://colab.research.google.com/drive/1AJRCZPX7AO85J9tRfGJUcaRzQ_sWWGIU#scrollTo=2CTJZb9D1hql Dataset is available on Kaggle Football Analytics Dataset Overview This dataset offers a...

Create Interactive Dashboard using Python – Pandas, Dash and Plotly

To display the components (dropdowns and graphs) in one row with three columns, we can use Dash’s built-in layout structure...

IPL Dataset for Sports Data Analysis

download matches csv download deliveries csv Read these conditions before downloading the file: Source of these files is Kaggle.com These...

Sample Country Data for Exploratory Data Analysis

Code Name Continent Region SurfaceArea IndepYear Population LifeExpectancy GNP GNPOld LocalName GovernmentForm HeadOfState Capital Code2 ABW Aruba North America Caribbean...

What is an Lmplot() in Seaborn ? With Example

What is an Lmplot() in Seaborn ? With Example It is a combination of Scatter Plot and Regression Line. A...

What are Pivot Tables ? In SQL How to Create Pivot Tables ?

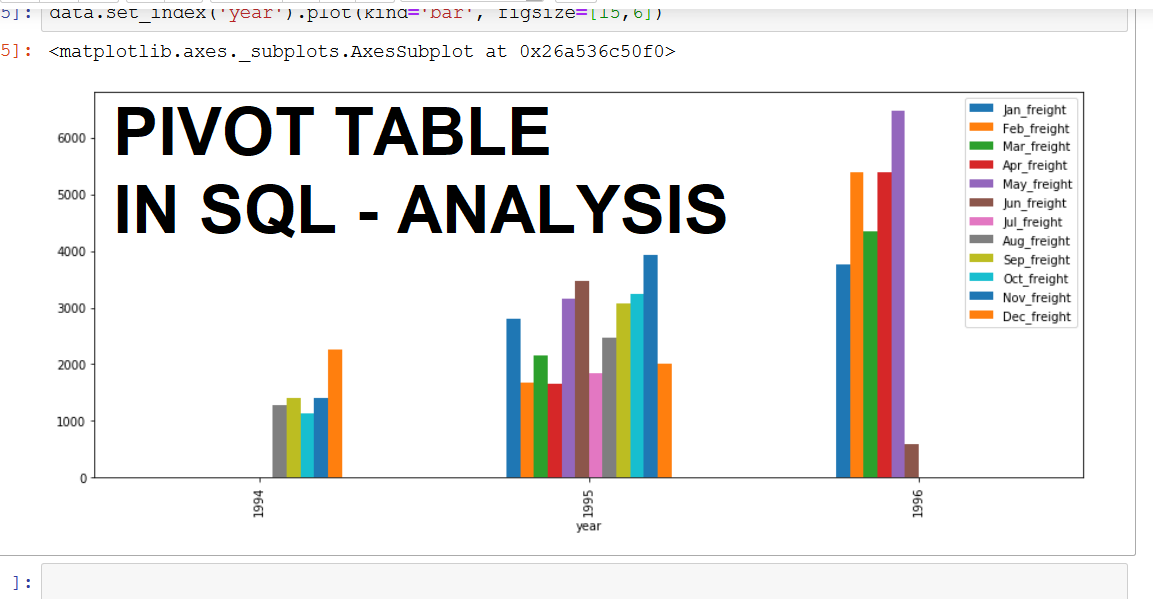
Pivot tables are used to generate table of statistics from a given table. It is a table where we put some summary from a given table. In this summary we can put sums, averages, count or other...

date_range() Method in Python Pandas

Working With time Series - date_range() Method in Python Pandas *It is used to generate a range of date values...
Scroll to Top