
Sample Country Data for Exploratory Data Analysis
Code Name Continent Region SurfaceArea IndepYear Population LifeExpectancy GNP GNPOld LocalName GovernmentForm HeadOfState Capital Code2 ABW Aruba North America Caribbean […]
Code Name Continent Region SurfaceArea IndepYear Population LifeExpectancy GNP GNPOld LocalName GovernmentForm HeadOfState Capital Code2 ABW Aruba North America Caribbean […]
What is an Lmplot() in Seaborn ? With Example It is a combination of Scatter Plot and Regression Line. A
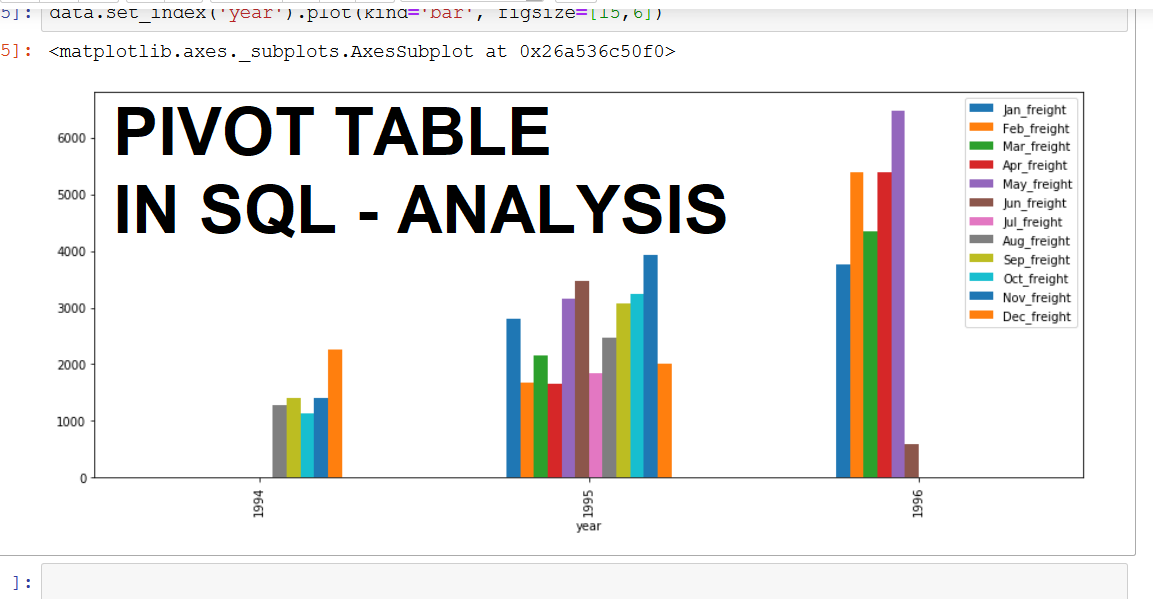
Pivot tables are used to generate table of statistics from a given table.
It is a table where we put some summary from a given table. In this summary we can put sums, averages, count or other statistics, which the pivot table groups together in a meaningful way.