

Employee Data Analysis Dashboard using Power Query Editor – Track Work Hours, Departments & Punctuality
🎯 What This Dashboard Represents: This Employee Data Analysis Dashboard offers a visual overview of employee performance metrics like total […]
🎯 What This Dashboard Represents: This Employee Data Analysis Dashboard offers a visual overview of employee performance metrics like total […]

🎯 Objective: To provide a comprehensive overview of course participation, instructor involvement, and academic outcomes such as average grades and
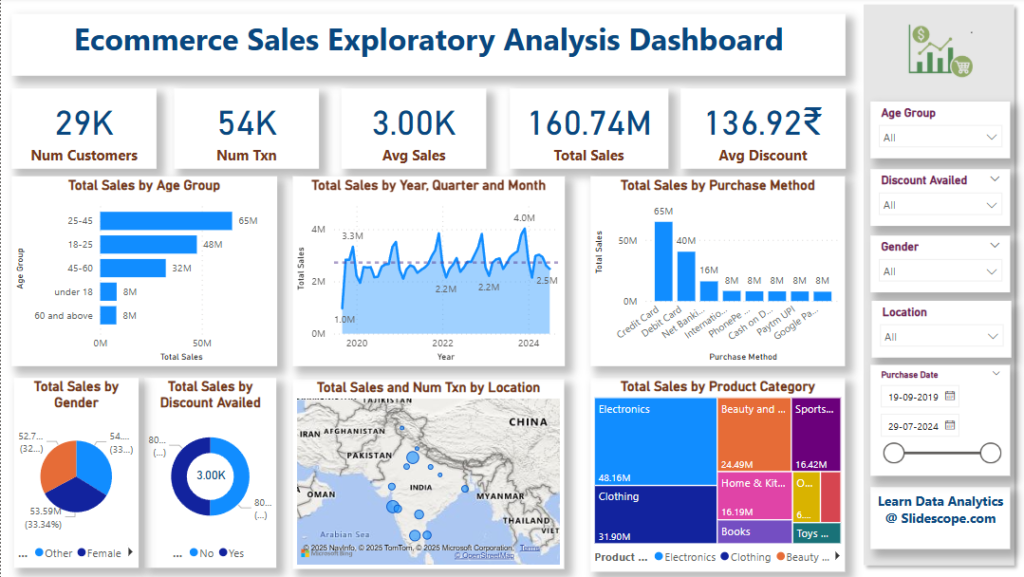
Welcome to this Power BI tutorial where we explore an interactive Ecommerce Sales Dashboard designed for deep and insightful business

This Power BI dashboard presents a comprehensive analysis of retail prices of products across various Canadian provinces, incorporating tax implications,
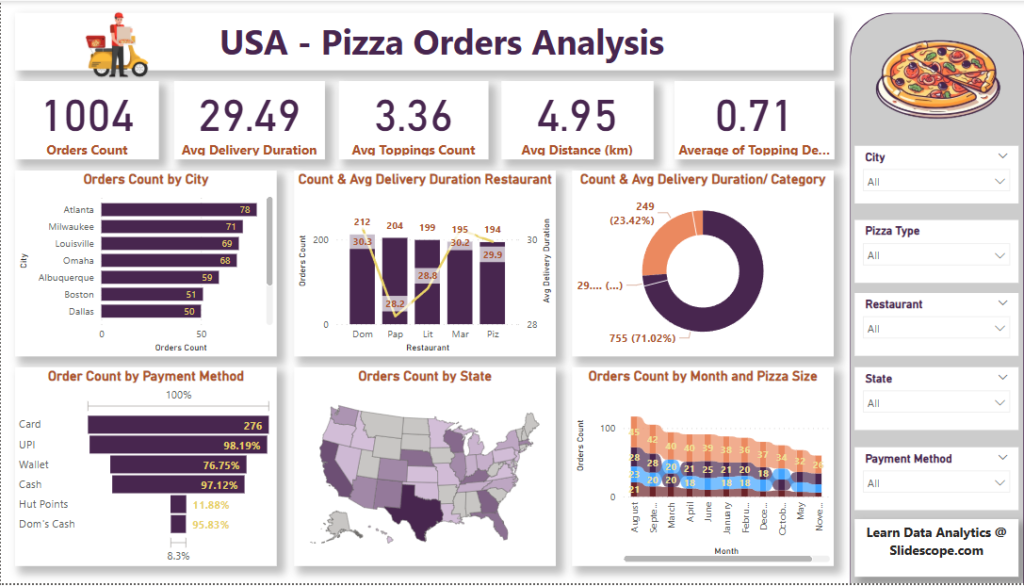
This is a Power BI dashboard titled “USA – Pizza Orders Analysis”, and it presents a comprehensive overview of pizza

🎯 Objective To track and analyze the performance of call center agents, call handling efficiency, customer satisfaction, and topic-wise issue

We will learn practical usage of following operators in Power BI Arithmetic operatorComparison operatorsText concatenation operatorLogical operators Here are DAX
Dataset: https://github.com/slidescope/data/blob/master/DAX_Count_Functions_Demo.csv Here are example DAX formulas using the dataset for understanding COUNT, COUNTA, COUNTX, and COUNTAX in Power BI:
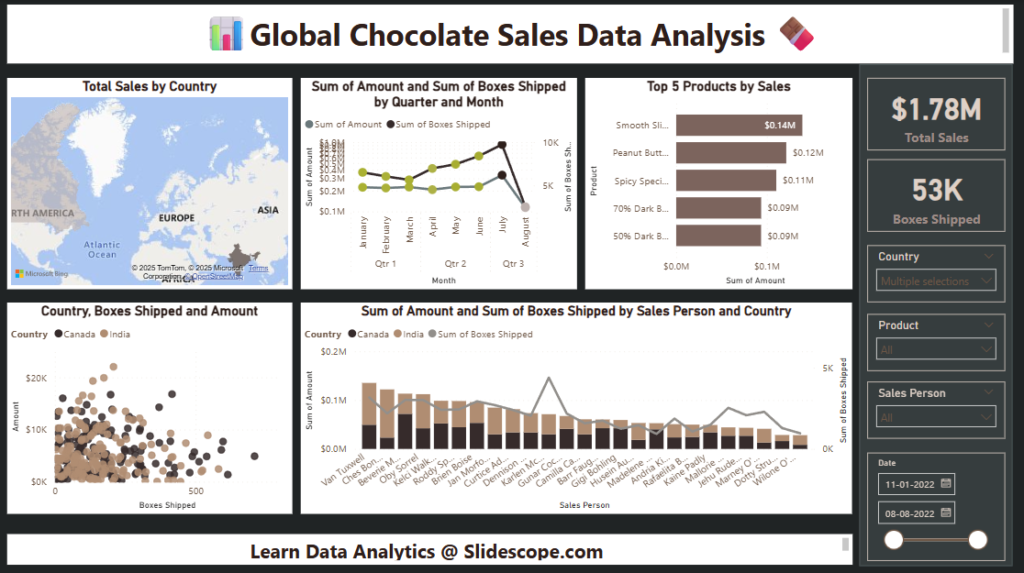
Unwrap Powerful Insights from Sweet Data! Dataset Overview:Dive into a rich dataset capturing the complete sales lifecycle of chocolate products.

📊 Dashboard IdeasSales Performance Overview Total Sales, Total Profit, Total Quantity (cards or KPI tiles) Profit by Product Category/Sub-Category (bar/column