
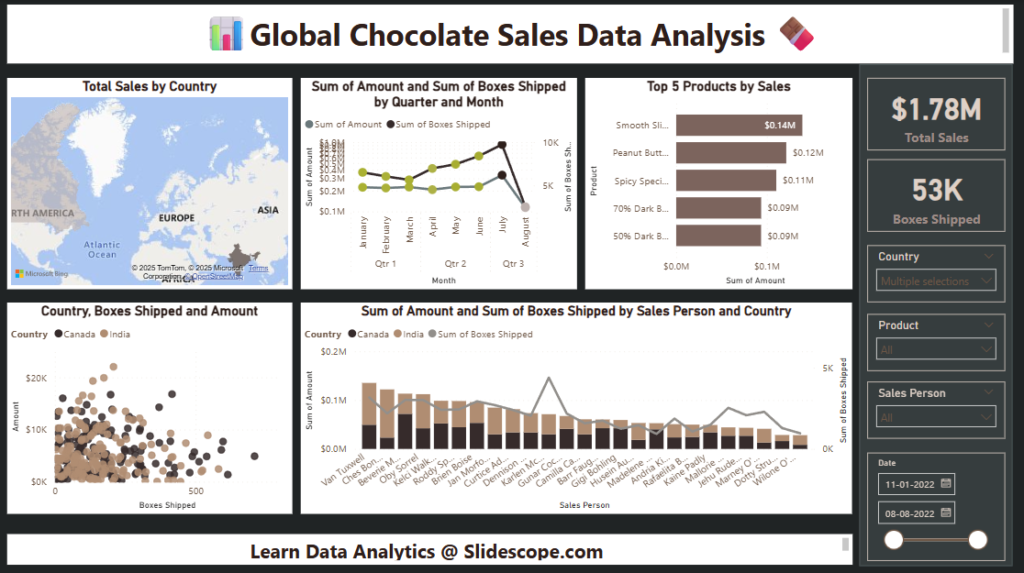
Power BI Dashboard Tutorial: Mastering Chocolate Sales Analysis
Unwrap Powerful Insights from Sweet Data! Dataset Overview:Dive into a rich dataset capturing the complete sales lifecycle of chocolate products. […]
Unwrap Powerful Insights from Sweet Data! Dataset Overview:Dive into a rich dataset capturing the complete sales lifecycle of chocolate products. […]

📊 Dashboard IdeasSales Performance Overview Total Sales, Total Profit, Total Quantity (cards or KPI tiles) Profit by Product Category/Sub-Category (bar/column

This is part 2 of DAX series on this project: Part 1 and Dataset is here : Employees-payroll-data-questions 🔢 DAX

This dashboard demonstrates the use of Power BI’s time intelligence functions—DATESYTD, DATESQTD, and DATESMTD—which help analyze year-to-date, quarter-to-date, and month-to-date

Here’s a summary of the 7 tables in the organic product sales dataset: The Dataset was found on kaggle :
On Star & Snowflake Schema Creating a Sales vs. Budget Analysis Dashboard in Power BI based on snowflake schema is
Budget vs Actual compares what was planned to be spent or earned (Budget) with what was actually spent or earned

📝 Why is the Data Collected? The data is collected from an online learning platform to monitor and optimize key

This Power BI dashboard titled “Global Student Social Media Usage & Addiction Insights” presents a comprehensive analysis of how students

Honey production dataset in the USA for the year 1998. Here’s a quick summary of the columns and their meanings