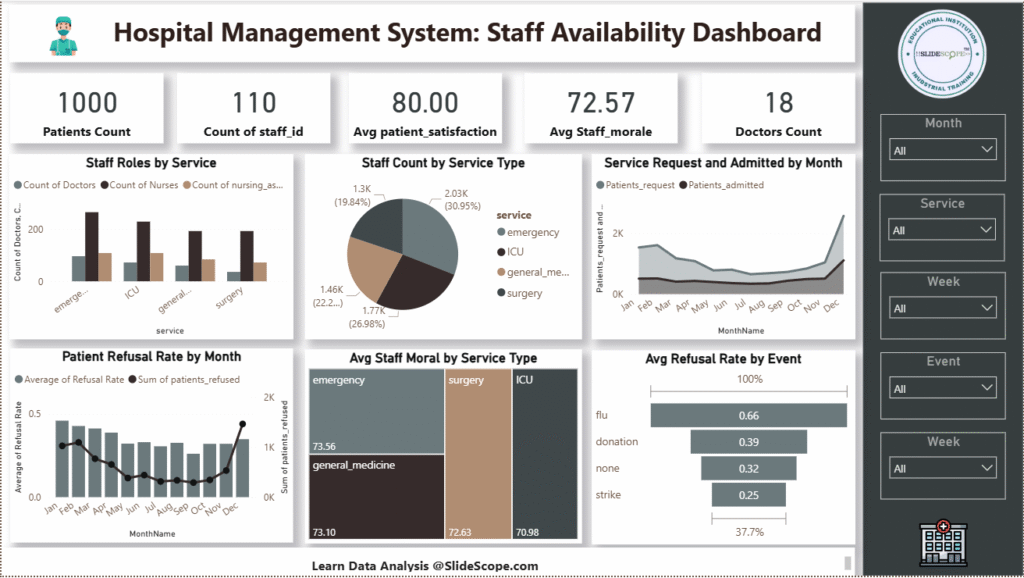
Understanding Waterfall Charts in Power BI: Perfect for Running Totals
When analyzing business data, one common requirement is to show how values accumulate over time or across different categories. For […]
✅ Part 1: Sales Overview Dashboard 📊 Part 2: Advanced Time Intelligence and DAX Objective: Teach key time-based analysis using
Project Overview The USA Car Sales Project is a comprehensive data visualization initiative focused on uncovering actionable insights in the
This Power BI dashboard project analyzes health insurance data of patients across different regions of the United States. Using a
Introduction Power BI, developed by Microsoft, is a powerful data visualization and business intelligence tool widely used across industries. But
This is part 6 of the IPL Cricket Data Analysis Project with Power BI and DAX where we are doing
This Power BI dashboard provides a comprehensive view of advertising spending trends globally from the year 2000 to 2024, along
This is Part 4 Of the IPL Data Analysis project. In this part you will learn important questions that will
This Power BI dashboard titled “Crop Yield Data Analysis from JSON API with Authentication” showcases agricultural insights derived from a
With the help of Slidescope’s Data Engineering team we have prepared sample JSON API 👉 https://coursetraining.in/jsonstore/data.php?s=orders You can connect Power