
Global Online Course Enrollment & Performance Dataset for Analysis and ML Projects
Dataset By: Ankit Srivastava – Slidescope Training Institute 📖 Dataset Overview The Global Online Course Enrollment & Performance Dataset is […]
Dataset By: Ankit Srivastava – Slidescope Training Institute 📖 Dataset Overview The Global Online Course Enrollment & Performance Dataset is […]
In Power BI we already did Exploratory data analysis and you can find the tutorials here Quick overview of the
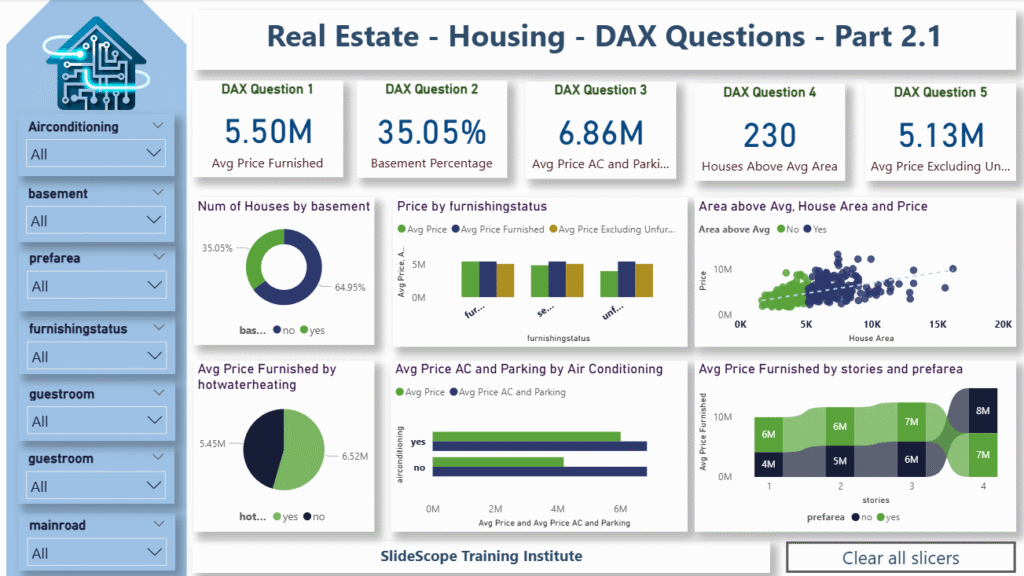
Here are 10 intermediate-to-advanced DAX questions based on your Housing dataset, along with complete DAX solutions. All questions use the
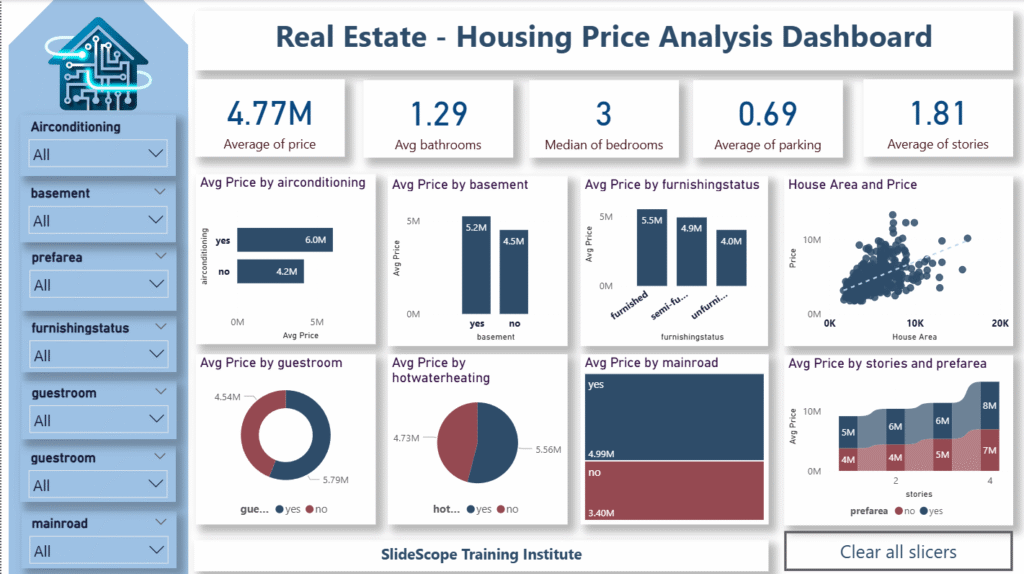
By Ankit Srivastava Understanding real estate pricing is one of the most important analytical skills today. Whether you’re a data
A Practical, Analytics-Driven Guide for Students, Professionals & Data Enthusiasts Download Dataset Here As someone who has spent over a
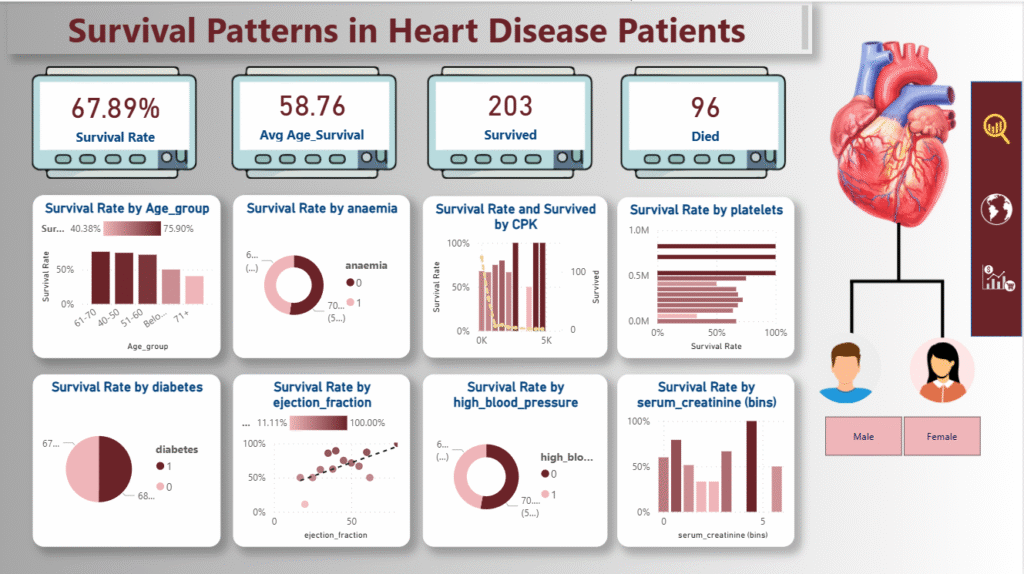
By Ankit Srivastava – Data Analyst & BI Consultant Data visualization can turn complex medical data into life-saving insights. In
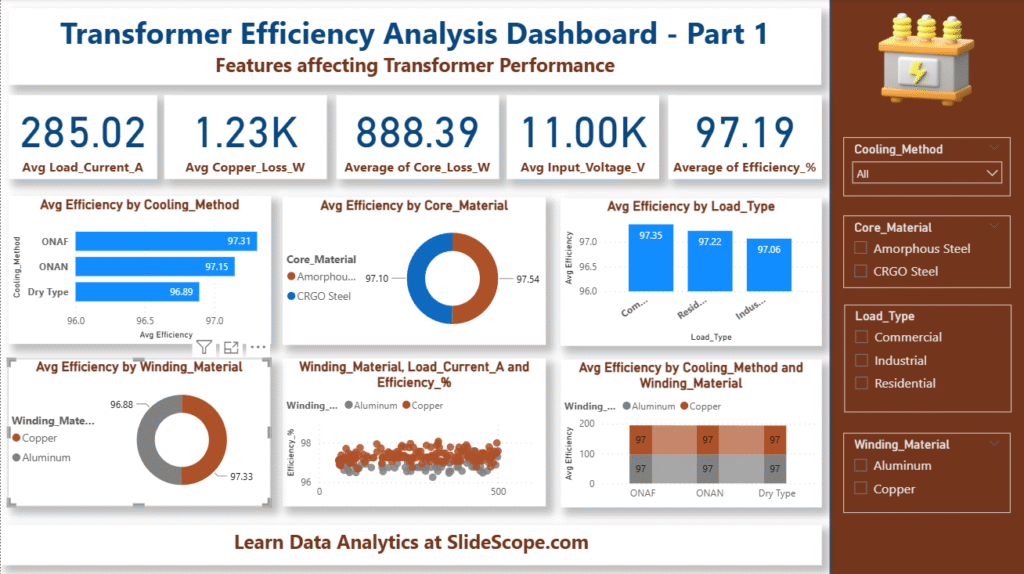
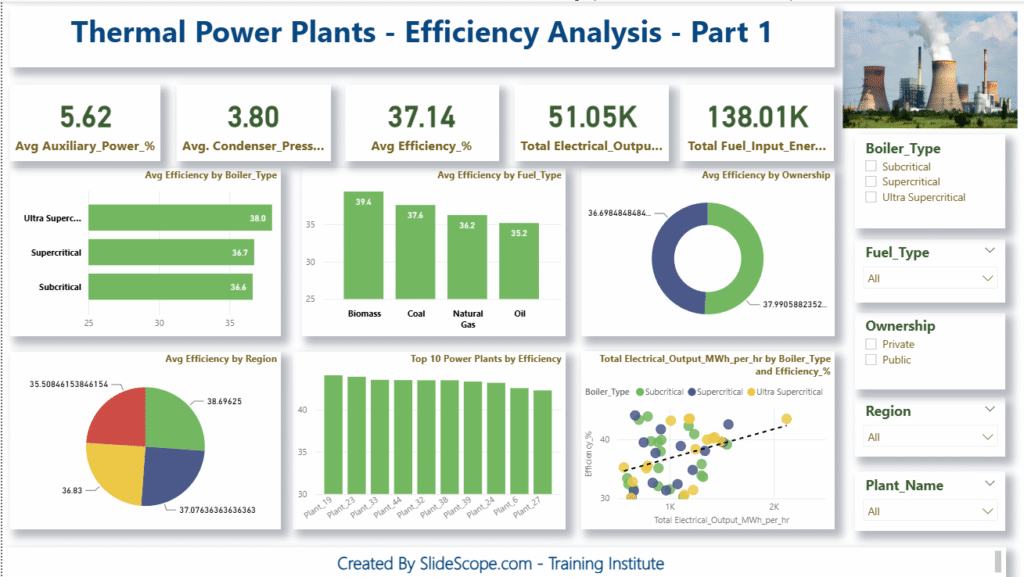
By Ankit Srivastava | Data Analytics & Visualization Expert Introduction Transformers are at the heart of every power distribution system.
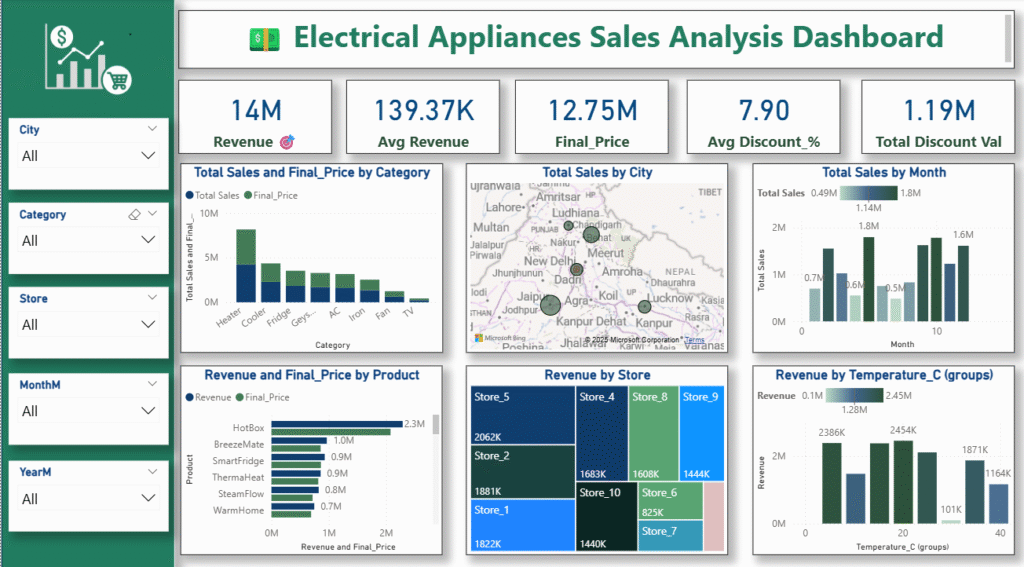
By Ankit Srivastava If you’ve ever wanted to analyze your business data visually — from total revenue to city-wise performance
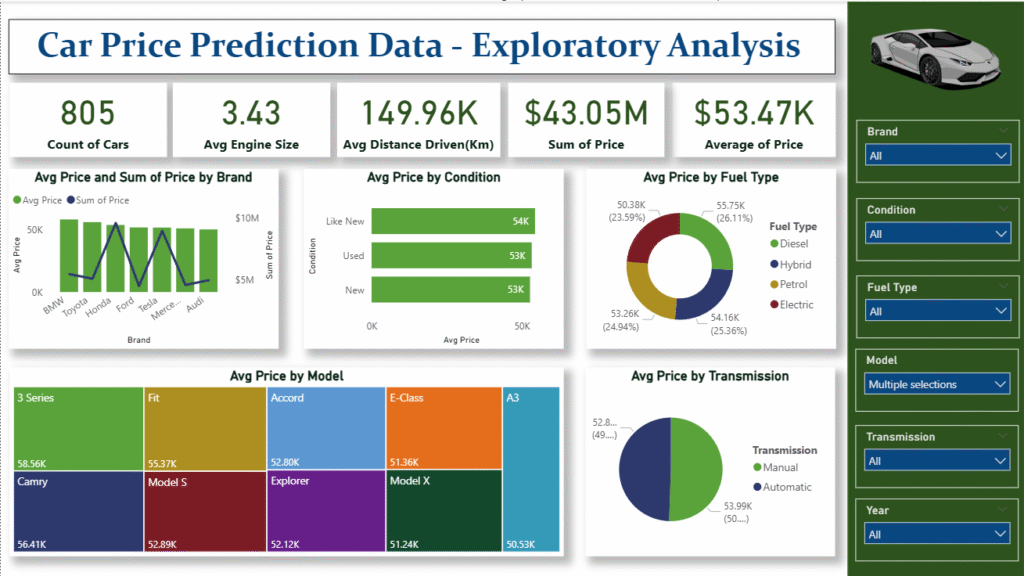
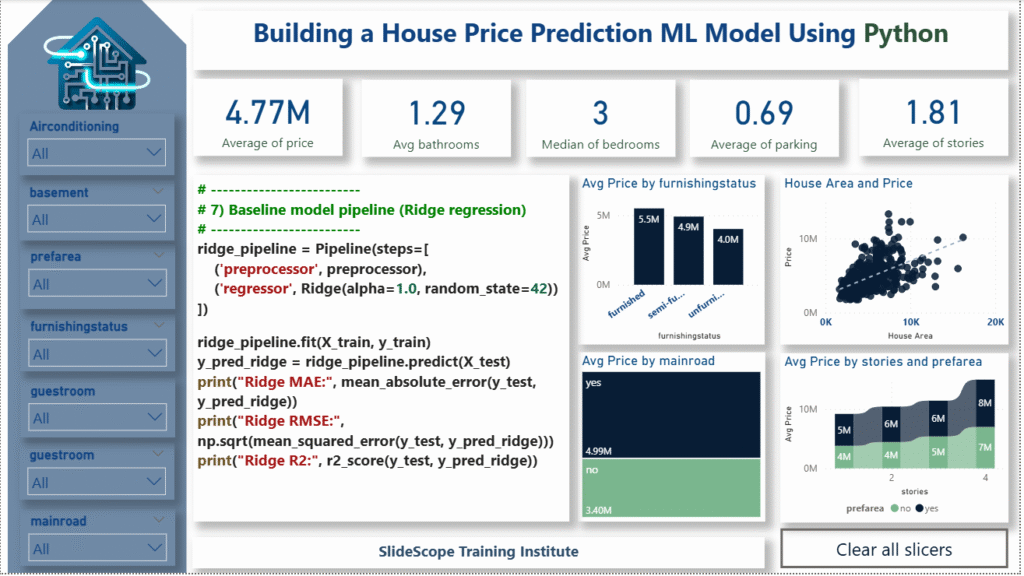
As data professionals, we often face one common challenge — understanding the story behind the data before building predictive models.
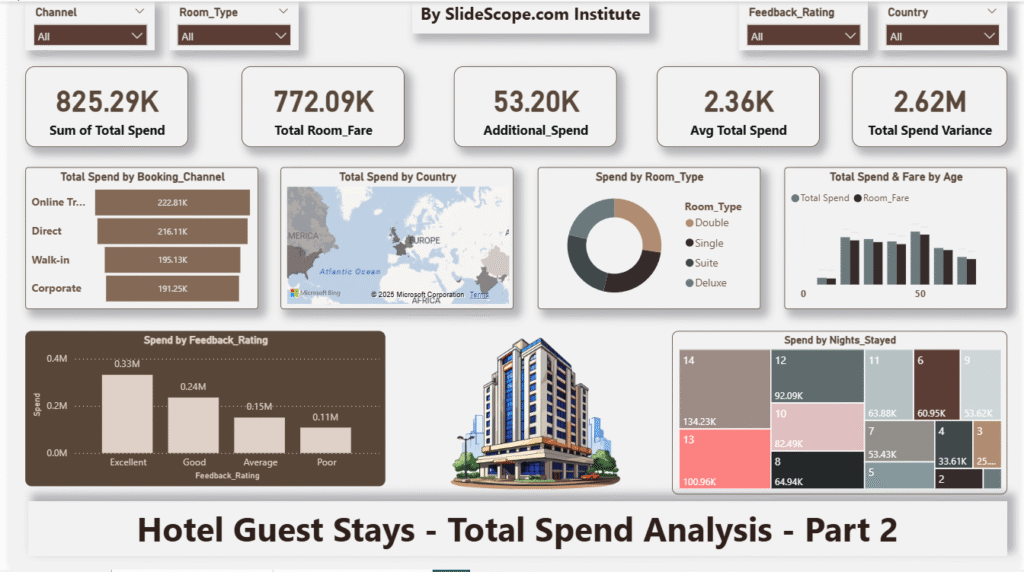
By Ankit Srivastava | Data Analytics & Power BI Instructor | SlideScope.com Institute Welcome back to Part 2 of our