
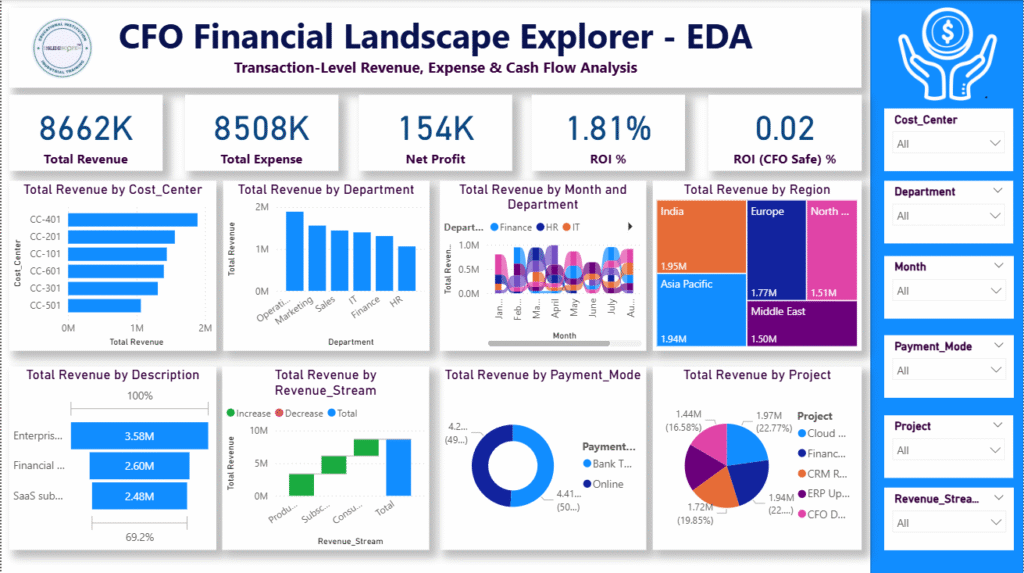
CFO-level Business Intelligence KPIs and Measures for Data Visualization
We are continuing our discussion from previous part (Click Here) and here we will create 10 more measures to use […]
We are continuing our discussion from previous part (Click Here) and here we will create 10 more measures to use […]
1. Overview of the Dataset This dataset represents a realistic, transaction-level financial extract typically used by CFOs, finance controllers, FP&A
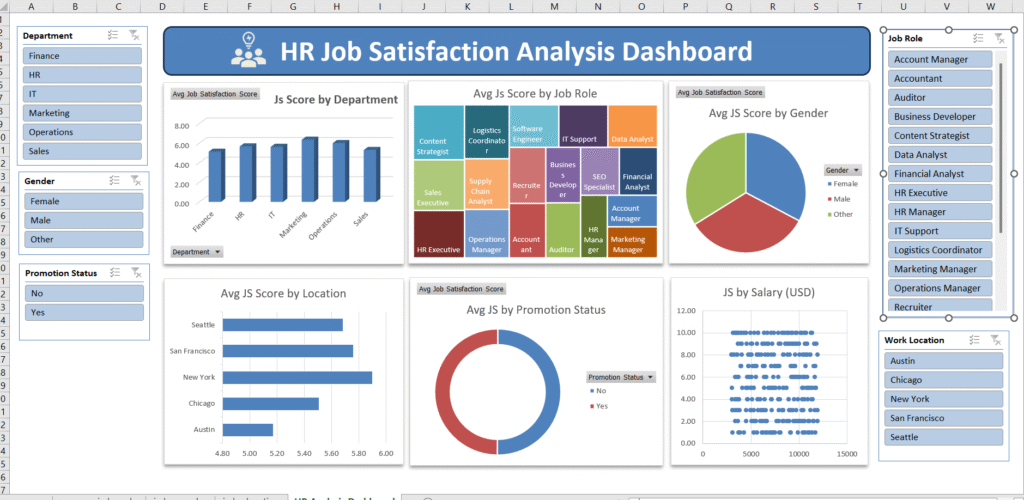
This tutorial explains how to design a professional HR analytics dashboard in Microsoft Excel to analyze employee job satisfaction across
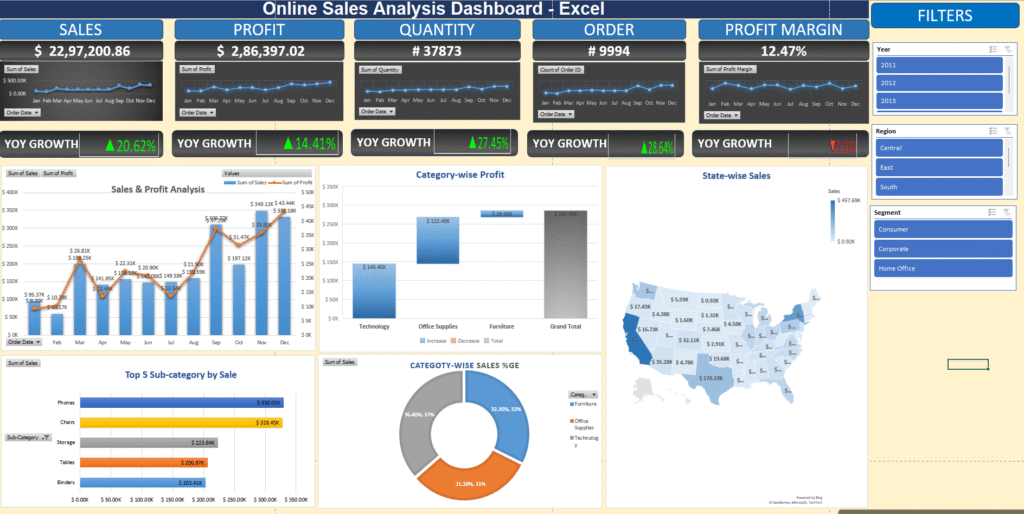
In today’s data-driven world, raw Excel files are no longer enough. Businesses, educators, and analysts need actionable insights, not just
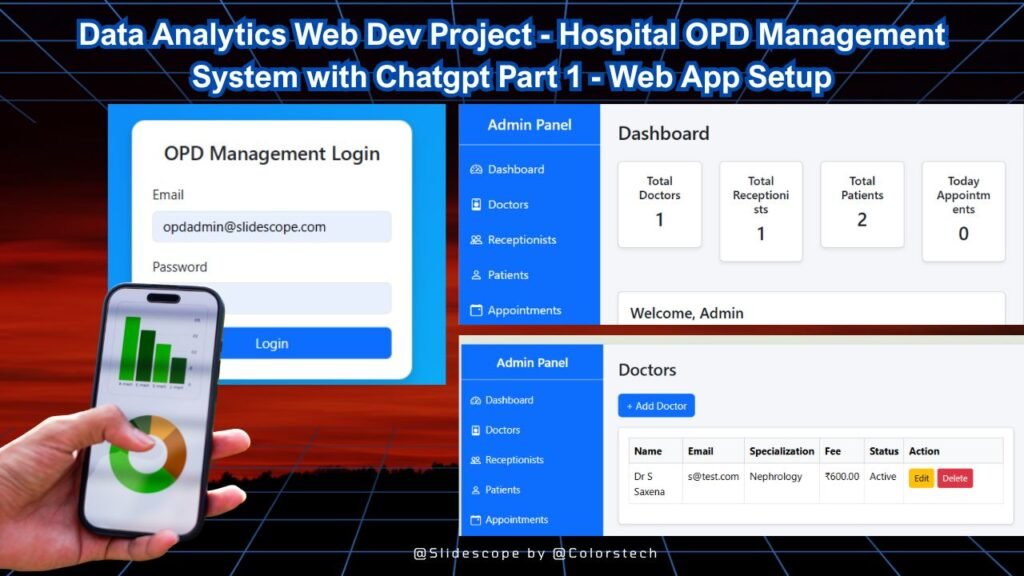
Hospital OPD Management System Using Web Development & Data Analytics – Project Overview In today’s data-driven healthcare environment, hospitals and
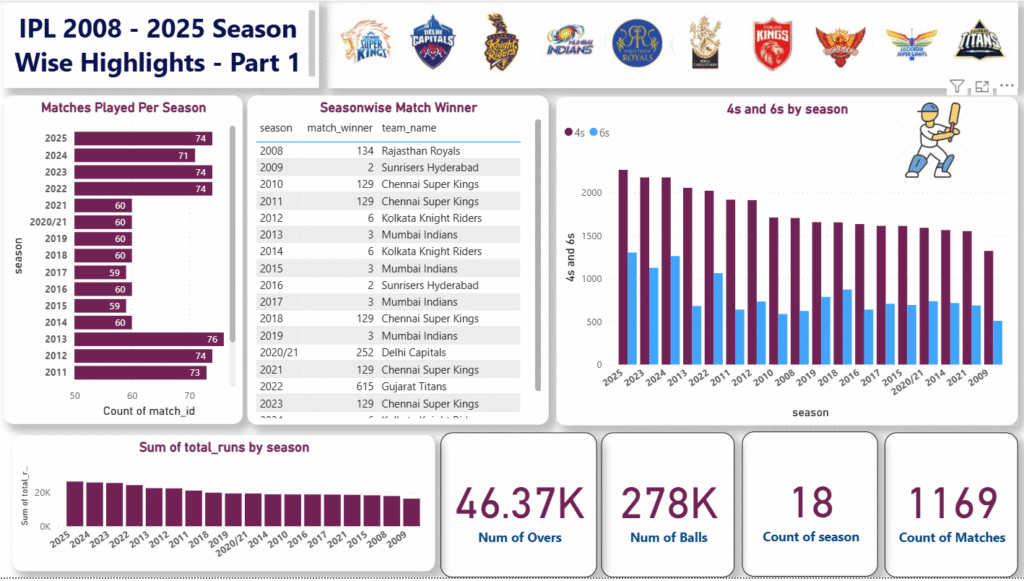
Below are DAX measures for bowler analytics, designed for our existing model that we created in First Part. These cover
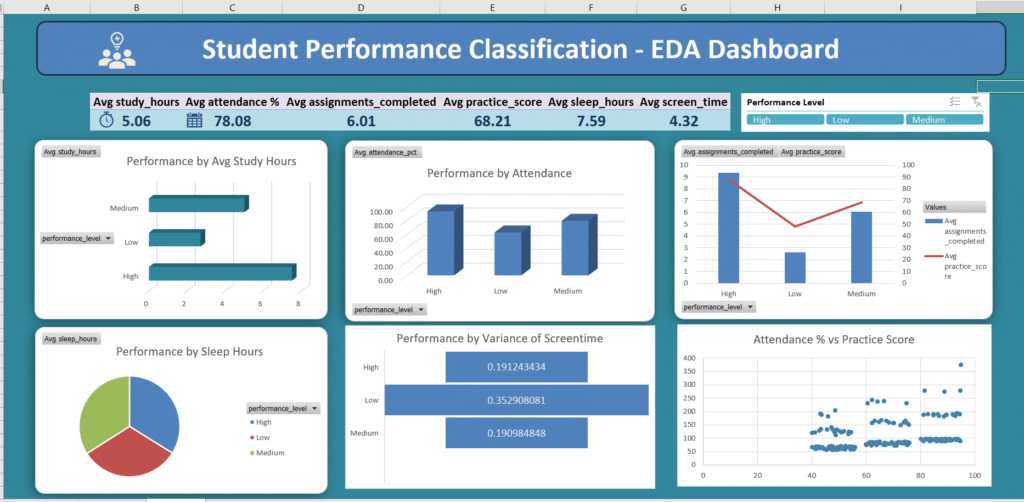
Introduction When people talk about analytics dashboards, they usually jump straight to Power BI or Python. But over the years,
Introduction This tutorial was created after an interesting and very real learning moment. A student, while searching for hands-on Excel
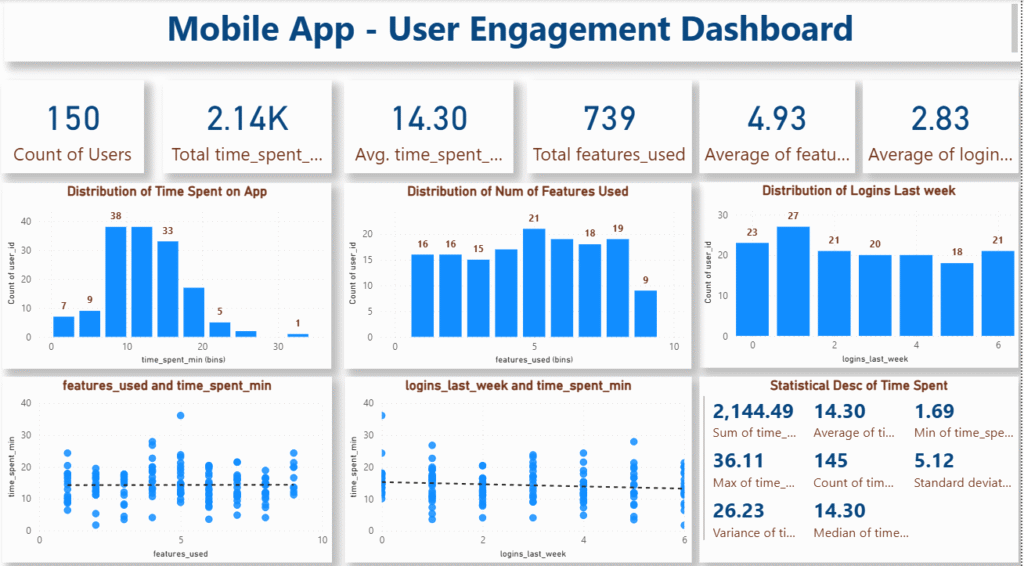
A Complete Step-by-Step TutorialBy Ankit Srivastava Building a user engagement dashboard is one of the most practical exercises for any
Our model that we create in Part 1 of this project, is already strong enough to calculate batsman performance accurately.