
Healthcare data has always been one of the most valuable resources for medical professionals, researchers, and policy makers. The Hospital Patient Records dataset simulates anonymized medical records for 350 patients and provides a structured view of patient demographics, medical assessments, hospital interactions, and treatment outcomes. This dataset is ideal for practicing data analysis, data visualization, predictive modeling, and healthcare analytics. By combining both numerical and categorical variables, it allows learners to perform a wide range of tasks including descriptive statistics, correlation analysis, and machine learning model training.
Purpose of the Dataset
The primary purpose of this dataset is to provide a realistic yet synthetic collection of patient information that can be safely used for academic projects, data science learning, business intelligence (BI) dashboards, and statistical modeling without violating patient privacy. Since real patient data is sensitive and governed by privacy regulations like HIPAA, GDPR, or local health laws, this synthetic dataset serves as a practical alternative. It mimics realistic hospital scenarios and helps learners understand patterns in healthcare costs, treatment outcomes, and resource utilization.
Another purpose is to give students and analysts the opportunity to work with data that exhibits relationships between variables. For example, in this dataset, there is a positive correlation between Test Results Score and Medical Bill Amount—patients with higher test result scores (indicating more complex cases) tend to have higher medical bills. Such correlations make the dataset useful for scatter plot visualizations, regression modeling, and predictive analysis.
Get the Dataset and Canvas Image Here: https://github.com/slidescope/Power-BI-Tutorial-Hospital-Patients-Insurance-Records-Analysis-Dashboard
Dataset Columns and Their Meaning
| Column Name | Data Type | Description |
|---|---|---|
| Patient_ID | Identifier | Unique alphanumeric ID assigned to each patient (e.g., P1001). |
| Age | Numerical | Patient’s age in years (1–90). Helps analyze healthcare utilization by age group. |
| Days_Admitted | Numerical | Number of days the patient stayed in the hospital. Useful for length-of-stay analysis and resource planning. |
| Test_Results_Score | Numerical | A synthetic score between 0–100 representing diagnostic or test results. Higher scores often reflect more severe or complex cases. |
| Medical_Bill_Amount | Numerical | Hospital bill amount in USD. Positively correlated with test results score to reflect realistic cost scenarios. |
| Gender | Categorical | Gender of the patient (Male, Female, Other). Allows demographic segmentation. |
| Department | Categorical | Department where the patient was treated (Cardiology, Neurology, Orthopedics, Pediatrics, Oncology, General Medicine). |
| Insurance_Type | Categorical | Type of insurance coverage (Private, Government, None). Useful for studying payment methods and healthcare accessibility. |
| Treatment_Outcome | Categorical | Final health status after treatment (Recovered, Improved, Critical, Deceased). Helps analyze treatment effectiveness. |
Example Use Cases
This dataset can be applied to various real-world scenarios in analytics and learning:
- Business Intelligence Dashboards – Visualize patient distribution by department, insurance type, or treatment outcome. Analyze costs across different demographics.
- Healthcare Cost Analysis – Study how age, length of stay, and test results affect hospital billing. Identify which groups generate the highest medical expenses.
- Predictive Modeling – Use machine learning to predict the likelihood of a patient’s outcome (Recovered, Improved, Critical, or Deceased) based on age, department, and medical history.
- Resource Management – Hospitals can analyze which departments tend to admit patients for longer stays, assisting in staffing and bed allocation decisions.
- Insurance and Policy Research – Compare the cost burden between private, government-insured, and uninsured patients to study healthcare financing.
Sample Analytical Questions
To make the dataset practical, learners can attempt the following analytical questions:
- Which hospital department generates the highest average medical bill?
- Do older patients tend to stay admitted for longer periods?
- Is there a strong correlation between Test Results Score and Medical Bill Amount?
- How do treatment outcomes vary across departments?
- What percentage of patients without insurance face bills higher than the average?
- Are male or female patients admitted for longer on average?
- Does insurance coverage type influence treatment outcome distribution?
Why This Dataset is Useful
This dataset provides a balanced mix of categorical and numerical variables, making it suitable for both beginner and advanced data analysis tasks. Beginners can practice creating pivot tables, bar charts, scatter plots, and summary statistics. Intermediate learners can explore regression analysis and classification models. Advanced learners can simulate predictive healthcare models, risk scoring, and insurance claim analysis.
By including a realistic correlation between test scores and medical bills, the dataset introduces complexity that reflects real-world scenarios where severity of illness impacts hospital costs. This makes it a highly engaging dataset for practice, teaching, and demonstration.
✅ In summary, the Hospital Patient Records dataset (350 rows, 9 columns) is a versatile learning resource that mimics healthcare data while ensuring privacy. It enables a wide variety of analytical exercises, from descriptive statistics to predictive modeling, and serves as an excellent tool for data science students, healthcare researchers, and BI professionals alike.
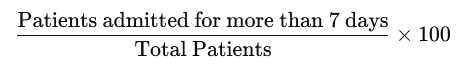
👉 Definition:
Bed Utilization Index =
DAX Measure
Bed Utilization Index (%) =
VAR TotalPatients =
    COUNTROWS ( hospital_patient_records )
VAR LongStayPatients =
    CALCULATE (
        COUNTROWS ( hospital_patient_records ),
        hospital_patient_records[Days_Admitted] > 7
    )
RETURN
DIVIDE ( LongStayPatients, TotalPatients, 0 ) * 100
✅ This measure will give you the percentage of patients admitted for more than 7 days.
You can place it on a Card visual in Power BI to display the KPI.