
Dataset By: Ankit Srivastava – Slidescope Training Institute
📖 Dataset Overview
The Global Online Course Enrollment & Performance Dataset is a structured, multi-dimensional dataset designed to represent real-world patterns of student enrollment, engagement, performance, and completion status across various online and blended learning programs worldwide.
This dataset simulates learner behavior across multiple professional domains such as Data Science, Web Development, Digital Marketing, AI & Machine Learning, and Cybersecurity, making it highly suitable for educational analytics, business intelligence dashboards, predictive modeling, and academic research.
With 250 structured rows and 10 well-defined columns, the dataset captures information related to student scores, attendance, assignments, project completion, learning mode, geographic region, and course completion status. It is intentionally crafted to support data visualization, trend analysis, segmentation analysis, and performance optimization studies.
Get the dataset here: Download🧾 Column Information (Detailed Explanation)
Below is the full explanation of all 10 columns used in your dataset:
1️⃣ Student_ID
Type: Integer
Description:
This column represents the unique identification number assigned to each learner. It ensures that every student record is distinct and traceable.
Purpose:
- Primary key for the dataset
- Used for joining with other academic or financial datasets
- Helps in tracking individual progress without revealing personal identity
2️⃣ Score
Type: Integer (Numeric)
Description:
Represents the overall performance score of a student in the course, typically measured on a scale of 0–1000 or normalized scoring structure.
Purpose:
- Measures academic achievement
- Used to compare top performers
- Helps identify learning effectiveness
3️⃣ Attendance_Percentage
Type: Integer
Description:
Indicates the percentage of live or recorded sessions attended by the student throughout the course duration.
Purpose:
- Correlates engagement with performance
- Helps measure student discipline
- Used for dropout prediction models
4️⃣ Assignments_Submitted
Type: Integer
Description:
Shows the number of assignments successfully submitted by a learner during the course.
Purpose:
- Tracks learning consistency
- Used to evaluate seriousness and effort
- Supports academic performance modeling
5️⃣ Projects_Completed
Type: Integer
Description:
Represents the total number of industry or capstone projects completed by the student.
Purpose:
- Measures practical exposure
- Helps evaluate job-readiness
- Used in placement analytics
6️⃣ Practical_Hours
Type: Integer
Description:
Indicates the total hours spent by the learner in hands-on practice, labs, or simulations.
Purpose:
- Measures real skill development
- Used for performance correlation
- Supports career outcome predictions
7️⃣ Course_Name
Type: Text (Categorical)
Sample Values:
- Data Science
- Web Development
- Digital Marketing
- AI & ML
- Cybersecurity
Description:
Represents the professional training program enrolled by the learner.
Purpose:
- Course-wise performance comparison
- Market demand analysis
- Enrollment trend analysis
8️⃣ Learning_Mode
Type: Text (Categorical)
Sample Values:
- Live
- Self-Paced
- Blended
Description:
Defines the format of content delivery selected by the student.
Purpose:
- Comparing engagement across modes
- Optimizing content delivery strategy
- Improving student satisfaction
9️⃣ Country
Type: Text (Geographic)
Sample Values:
- India
- USA
- UK
- Canada
- Australia
Description:
Represents the geographical location of the learner, allowing global distribution analysis.
Purpose:
- Regional demand analysis
- Market expansion planning
- Localization strategy building
🔟 Completion_Status
Type: Text (Categorical)
Sample Values:
- Completed
- In Progress
- Dropped
Description:
Shows the current status of the learner’s journey in the course.
Purpose:
- Dropout analysis
- Course quality evaluation
- Success rate calculation
📊 Key Characteristics of the Dataset
✅ Balanced distribution of completion, in-progress, and dropout records
✅ Global learner distribution across 5 major countries
✅ Covers high-demand tech skills
✅ Suitable for both beginner and advanced data analysis
✅ Optimized for Power BI, Python, Excel, SQL, and Machine Learning projects
🚀 Dataset Use Cases (Real-World Applications)
This dataset is extremely versatile and can be used for a wide range of professional and academic purposes:
1️⃣ Educational Performance Analytics
Institutes can analyze:
- Student success rates
- Engagement vs performance
- Impact of attendance on completion
- Assignment completion trends
This helps in curriculum improvement and teaching methodology optimization.
2️⃣ Power BI & Dashboard Projects
Ideal for:
- Learner performance dashboards
- Country-wise enrollment heatmaps
- Dropout rate analysis
- Course-wise revenue forecasting
- Learning mode adoption trends
Perfect for:
✅ Portfolio projects
✅ Interview demonstrations
✅ Corporate analytics training
3️⃣ Predictive Modeling & Machine Learning
Can be used for:
- Dropout prediction models
- Performance forecasting
- Student success classification
- Mode recommendation systems
Supports:
✅ Supervised regression
✅ Classification algorithms
✅ AI-based education tools
4️⃣ Marketing and Business Growth Strategy
Training companies can:
- Identify high-performing regions
- Optimize advertising for high-conversion countries
- Improve course pricing strategy
- Retarget dropout-prone learners
5️⃣ Student Behavior Analysis
Helps to study:
- Learning habits
- Practice pattern impact
- Project completion impact on course success
- Engagement psychology
6️⃣ Academic Research & Case Studies
Useful for:
- MBA case studies
- EdTech research
- Learning pattern research
- Education policy design
7️⃣ LMS (Learning Management System) Testing
Developers use this dataset to:
- Test reporting modules
- Build learner dashboards
- Simulate real-time student behavior
- Validate analytics pipelines
8️⃣ Corporate HR & L&D Analytics
Organizations can:
- Track employee upskilling
- Measure learning ROI
- Improve internal training programs
- Forecast skill gaps
9️⃣ Data Visualization & Storytelling Practice
Analysts can build:
- Funnel charts for student journey
- Performance vs attendance scatterplots
- Dropout trend line charts
- Geographic enrollment maps
🔟 AI-Based Course Recommendation Systems
This dataset supports:
- Personalized learning paths
- Skill-based content recommendation
- Adaptive learning platforms
✅ Advantages of This Dataset
✔ Realistic simulation of EdTech industry
✔ Structured for BI and ML projects
✔ Country-level segmentation
✔ Multi-course distribution
✔ Suitable for beginners and professionals
✔ Avails end-to-end learner life cycle analysis
🎯 Final Summary
The Global Online Course Enrollment & Performance Dataset is a powerful, structured, and industry-aligned dataset that enables deep insights into student behavior, academic performance, learning modes, and geographic engagement. With its 10 carefully designed features and 250 realistic records, it can be applied across education analytics, marketing intelligence, data science training, LMS development, and predictive analytics.
It is perfectly suited for:
✅ Power BI portfolios
✅ Python data analysis
✅ Machine learning models
✅ Excel dashboards
✅ Business analytics reports
✅ Academic research
✅ 12 Data Analysis Problem Statements
- What factors most strongly influence quiz scores—watch time, login frequency, or assignments?
- Which course category has the highest average completion rate?
- Does learning mode (Self-Paced vs Live) affect student performance?
- Which countries show the highest learner engagement?
- What is the relationship between time spent per session and quiz scores?
- At what point does login frequency stop improving performance?
- Are assignments completed a stronger predictor of success than watch time?
- Which course categories have the highest dropout risk?
- How does completion status vary by learning mode?
- Do students with low watch time but high login frequency perform better or worse?
- Which regions produce the highest scoring students?
- Can we predict course completion using engagement metrics?
✅ 5 KPIs (Key Performance Indicators)
- Average Quiz Score
- Measures overall learner performance.
- Course Completion Rate (%)
- Shows the percentage of students who successfully complete courses.
- Engagement Index
- A composite metric using:
(Watch Time + Login Frequency + Assignments Completed) / 3 - Dropout Rate (%)
- Tracks learner attrition.
- Average Time Spent per Session
- Measures learning depth per visit.
Great question — this is a custom business metric, not a standard statistical formula. Let me explain it clearly.
✅ What Is the Engagement Index?
The Engagement Index is a composite score designed to represent a learner’s overall activity level on an online learning platform. Instead of looking at watch time, logins, or assignments separately, this index combines multiple behaviors into a single value so you can:
- Rank students by engagement
- Compare engagement across courses
- Correlate engagement with quiz scores and completion
- Identify at-risk vs highly active learners
It is widely used in:
- EdTech analytics
- Learning Management Systems (LMS)
- Power BI & ML models
- Student success prediction
This is simply an arithmetic mean of three engagement signals.
✅ Meaning of Each Term:
- Watch Time → How long the student watches learning videos
- Login Frequency → How often the student opens the platform
- Assignments Completed → How much practical work is done
- 3 → Total number of engagement components
So mathematically, this is:
👉 “The average of three engagement behaviors.”
⚠️ Important Limitation of This Simple Formula
This formula only works correctly if all three variables are on the same scale.
Example problem:
- Watch Time = 300 minutes
- Login Frequency = 15
- Assignments = 6
Then:
[
(300 + 15 + 6) / 3 = 107
]
Here, Watch Time dominates the score, which makes the index misleading.
✅ Correct Industry-Grade Formula (Normalized Engagement Index)
To make it statistically valid, we normalize each variable first:
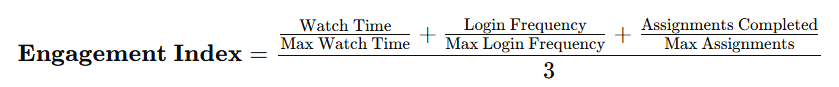
This converts each metric into a 0–1 scale, making them comparable.
✅ Power BI DAX Version (Correct Method)
Engagement Index =
VAR WT = DIVIDE([Watch Time], CALCULATE(MAX('Table'[Watch Time])))
VAR LF = DIVIDE([Login Frequency], CALCULATE(MAX('Table'[Login Frequency])))
VAR AC = DIVIDE([Assignments Completed], CALCULATE(MAX('Table'[Assignments Completed])))
RETURN
AVERAGE({WT, LF, AC})
This will return a value between 0 and 1, where:
- 0.80 – 1.00 → Highly engaged
- 0.50 – 0.79 → Moderately engaged
- Below 0.50 → At-risk students
✅ Why We Divide by 3
Because you are combining three different engagement dimensions:
- Consumption → Watch Time
- Activity → Login Frequency
- Effort → Assignments
Dividing by 3 gives their average contribution, instead of a total.
✅ Engagement Index Definition
Engagement Index is a composite behavioral metric calculated as the average of normalized watch time, login frequency, and assignments completed, used to quantify a student’s overall learning involvement.
✅ 7 Recommended Visualizations
- Bar Chart
- Average Quiz Score by Course Category
- Clustered Column Chart
- Completion Status by Learning Mode
- Scatter Plot
- Time Spent per Session vs Quiz Score
- Donut Chart
- Completion Status Distribution
- Map Visualization
- Learner Distribution by Country
- Line Chart
- Login Frequency vs Quiz Score Trend
- Stacked Bar Chart
- Assignments Completed by Course Category & Completion Status
✅ Bonus (If You Want Advanced Dashboard Add-ons)
- Performance Segmentation (Low / Medium / High)
- At-Risk Student Detection
- Course Demand Forecasting
- Region-wise Market Expansion Insights
- Personalized Learning Recommendation Models
Here are powerful, realistic, industry-ready ML problem statements for your Online Course Engagement Dataset. These are perfect for case studies, portfolio projects, or Power BI + ML hybrid dashboards.
✅ 12 Machine Learning Problem Statements for the Dataset
1. Predict Quiz Score (Regression)
Build a regression model using watch time, assignments completed, login frequency, and time spent per session to predict a student’s quiz score.
2. Predict Course Completion (Classification)
Use engagement metrics to classify whether a student will complete the course or drop out.
3. Student Performance Segmentation (Clustering)
Apply K-means or Hierarchical Clustering to group students into:
- High performers
- Moderate performers
- At-risk learners
based on behavior and performance scores.
4. Early Dropout Prediction Model
Use first 20% of engagement data to predict whether the learner will drop out early.
5. Predict Learning Mode Preference (Classification)
Analyze which students prefer Self-paced vs Live sessions using behavioral patterns.
6. Recommendation System for Personalized Study Plan
Based on past engagement and performance, recommend:
- Ideal time per session
- Suggested number of assignments
- Watch time targets
7. Predict Engagement Level (Regression / Multi-class)
Build a model to estimate a student’s engagement index (high, medium, low).
8. Anomaly Detection (Isolation Forest / Autoencoders)
Identify unusual learners:
- Extremely low engagement
- Sudden drop in behavior
- Suspiciously high quiz scores with low activity
9. Multi-Output Prediction Model
Predict Quiz Score + Completion Status together based on engagement behavior.
10. Natural Language Processing (NLP) Enhancement
If reviews/comments are added later, build:
- Sentiment analysis model
- Feedback category classifier
11. Predict Assignment Completion Behavior
Predict whether a student will complete all assignments based on their early platform usage.
12. Predict Time Spent Per Session (Regression)
Determine what drives session duration and forecast future session length for each learner.
🎯 BONUS: 5 Advanced Machine Learning Project Ideas
- AI-Based Intervention System
Trigger alerts when a student is predicted to score < 50%. - Course Recommendation System
Recommend best-fit course category based on past behavior. - ENGAGEMENT → PERFORMANCE MODEL
Quantify the contribution of each variable:- How much does +10 minutes watch time improve quiz score?
- User Lifelong Learning Value (LTV Prediction)
Predict which learners return for more courses. - Explainable AI (XAI) Dashboard
Use SHAP values in Power BI to visualize:- “Why was this student predicted to drop out?”
✅ Conclusion
The Online Course Engagement Dataset provides a rich and realistic foundation for exploring how learner behavior translates into academic performance and course completion outcomes. By combining multiple engagement metrics such as video watch time, login frequency, time spent per session, and assignment completion with performance indicators like quiz scores and completion status, this dataset enables deep analytical and predictive insights. It supports a wide range of applications including descriptive analytics, Power BI dashboarding, machine learning modeling, and student success prediction. Overall, this dataset serves as a powerful resource for building real-world EdTech analytics solutions, enhancing learner outcomes, improving course design, and driving data-informed decision-making in digital education environments.