
“I am excited to present this Supply Chain Management Dashboard, a practical and industry-aligned analytics solution designed to translate complex operational data into clear, actionable insights. In today’s fast-moving business environment, supply chains are no longer just about procurement and logistics—they are strategic drivers of cost efficiency, service quality, and competitive advantage. This dashboard has been built with that exact mindset.” – Ankit Srivastava
Get the Dataset Here: https://github.com/slidescope/Supply-Chain-Management-Dataset
The primary objective of this dashboard is to provide a 360-degree view of supply chain performance by integrating cost, quantity, lead time, quality, supplier efficiency, and location-based analysis into a single interactive report. Instead of working with fragmented spreadsheets or static reports, decision-makers can now monitor key metrics in real time and identify trends, risks, and opportunities with ease.
This dashboard is structured to support multiple stakeholders. For operations teams, it highlights order volumes, lead times, and supplier performance to improve planning and execution. For procurement and finance teams, it delivers clear visibility into total cost, unit pricing, and supplier-wise cost distribution, enabling better negotiation and budgeting decisions. For quality and compliance teams, defect rates and inspection outcomes help track product reliability and process effectiveness.
A major strength of this report lies in its KPI-driven design. Metrics such as Total Cost, Ordered Quantity, Average Lead Time, and Average Defect Rate are calculated using robust DAX measures, ensuring accuracy and scalability. The inclusion of slicers like Product Type allows users to drill down into specific categories such as Cosmetics, Haircare, and Skincare, making the analysis both flexible and insightful.
Overall, this dashboard represents a real-world application of data analytics in supply chain management. It demonstrates how well-structured data models, meaningful KPIs, and thoughtful visualization can empower organizations to make faster, smarter, and more confident decisions.
This Supply Chain Management Dashboard provides a single, unified view of procurement, supplier performance, lead time efficiency, quality control, and cost analysis. It is designed to help operations managers, supply chain analysts, and decision-makers quickly understand how suppliers, products, and locations are performing.
The dashboard answers four critical business questions:
- How much are we ordering and spending?
- How efficient is our supply chain in terms of lead time?
- What is the quality level of supplied products?
- Which suppliers and locations are driving cost and revenue?
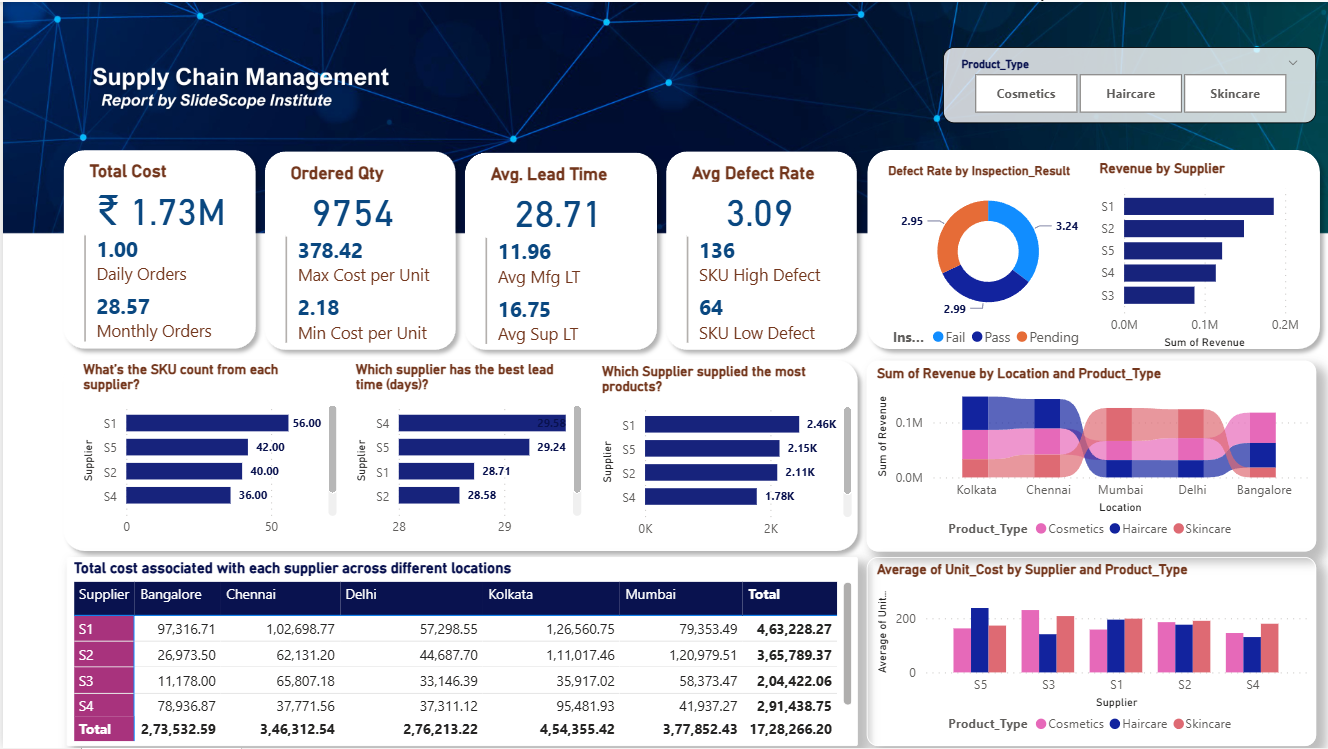
At the top, KPI cards summarize overall performance.
The middle section focuses on supplier comparisons.
The bottom section provides cost and pricing insights across locations and product types.
A Product_Type slicer (Cosmetics, Haircare, Skincare) allows users to dynamically analyze performance for specific categories, making the dashboard interactive and decision-oriented.
Dashboard Sections Explained
1️⃣ Executive KPI Summary (Top Cards)
These KPIs provide an instant snapshot of supply chain health:
- Total spending
- Order volume
- Lead time efficiency
- Product quality
This section is ideal for management review and quick decision-making.
2️⃣ Supplier Performance Analysis
This section answers:
- How many SKUs each supplier provides
- Which supplier has the fastest lead time
- Which supplier supplies the highest quantity
It helps identify best-performing and underperforming suppliers.
3️⃣ Quality Control & Revenue Insights
- Defect rate by inspection result (Pass / Fail / Pending)
- Revenue contribution by supplier
This enables risk assessment and supplier quality monitoring.
4️⃣ Cost & Pricing Analysis
- Location-wise total cost per supplier
- Average unit cost by supplier and product type
This section is crucial for cost optimization and negotiation strategies.
KPI Explanations (Used in This Dashboard)
Below is a business + analytical explanation of each KPI you used.
1️⃣ Daily Orders
What it shows:
Average number of orders placed per day.
Why it matters:
- Measures daily operational demand
- Helps in workforce planning and logistics scheduling
- Smooth demand indicates a stable supply chain
Business insight:
A sudden spike or drop may indicate seasonality, supply disruption, or demand volatility.
2️⃣ Monthly Orders
What it shows:
Average number of orders placed per month.
Why it matters:
- Helps in long-term demand planning
- Supports supplier capacity forecasting
- Useful for month-on-month trend analysis
Business insight:
Consistent monthly orders reflect predictable procurement behavior.
3️⃣ Total Cost
What it shows:
Total procurement expenditure calculated as:
Ordered Quantity × Unit Cost (summed across all orders)
Why it matters:
- Core financial KPI for supply chain
- Helps control procurement spending
- Directly impacts profit margins
Business insight:
High total cost may require supplier renegotiation or sourcing alternatives.
4️⃣ Min Cost per Unit
What it shows:
Lowest unit price across all products and suppliers.
Why it matters:
- Identifies most cost-efficient procurement opportunity
- Useful for benchmarking supplier pricing
Business insight:
Low unit cost does not always mean best value — it should be evaluated with defect rate and lead time.
5️⃣ Ordered Quantity
What it shows:
Total number of units ordered.
Why it matters:
- Indicates procurement volume
- Helps track inventory inflow
- Supports demand vs supply analysis
Business insight:
High quantity with high defect rate is a hidden operational risk.
6️⃣ Avg Supplier Lead Time
What it shows:
Average time taken by suppliers to deliver products after order placement.
Why it matters:
- Measures supplier reliability
- Impacts inventory holding cost and stock availability
Business insight:
Lower supplier lead time = more responsive supply chain.
7️⃣ Avg Lead Time (Days)
What it shows:
Average total lead time, including:
- Supplier Lead Time
- Manufacturing Lead Time
Why it matters:
- End-to-end supply chain efficiency metric
- Directly affects customer fulfillment timelines
Business insight:
High lead time increases working capital requirements and risk of stock-outs.
8️⃣ Average Defect Rate
What it shows:
Average percentage of defective units across all SKUs.
Why it matters:
- Quality control indicator
- Impacts returns, rework cost, and brand reputation
Business insight:
Even a small increase in defect rate can significantly increase hidden operational costs.
9️⃣ Defect Rate by Inspection Result
What it shows:
Distribution of defect rates across:
- Pass
- Fail
- Pending
Why it matters:
- Highlights inspection bottlenecks
- Helps prioritize quality audits
Business insight:
High “Pending” rates indicate process delays or inspection inefficiencies.
1️⃣0️⃣ Supplier & Location Cost Matrix
What it shows:
Total cost incurred by each supplier across different locations.
Why it matters:
- Identifies cost-heavy supplier-location combinations
- Enables regional cost optimization
Business insight:
Helps decide where to source from and which suppliers to scale or reduce.
1️⃣1️⃣ Average Unit Cost by Supplier and Product Type
What it shows:
Average pricing comparison across suppliers and product categories.
Why it matters:
- Supports pricing negotiations
- Helps identify category-wise cost leaders
Business insight:
A supplier may be cost-effective for one product type but expensive for another.
Final Learning Outcome (Very Important)
This dashboard demonstrates:
- Strong data modeling
- Correct DAX usage
- Business-oriented KPI design
- Real-world supply chain analytics thinking
This is portfolio-ready, interview-ready, and corporate-grade work.