
By Ankit Srivastava, Lead Digital Marketing Analyst and Head of IT Training at Slidescope Institute
Introduction: Why DAU Matters in Mobile App Growth
As a digital marketing leader with over 11 years of experience driving business growth through data-driven strategies, I’ve consistently found that Daily Active Users (DAU) is one of the most critical metrics for mobile app success. In this comprehensive tutorial, I’ll guide you through creating a powerful DAU analysis dashboard in Power BI—exactly like the one I built for analyzing mobile app usage patterns.
Having executed 80+ projects across various industries, I can confidently say that understanding your DAU patterns is the foundation of sustainable app growth. This dashboard doesn’t just show numbers; it reveals user behavior, platform preferences, and revenue opportunities.
Step 1: Data Preparation and Power BI Setup
Loading Your Dataset
First, let’s prepare our environment. The dataset is a CSV file containing mobile app usage data with the following columns:
- App ID
- App Category
- User Age Group
- Platform
- Region
- Daily Active Users
- Average Session Time (mins)
- Crash Rate (%)
- Total In-App Purchases
Get the dataset here: Mobile App Usage Data
Pro Tip from My Experience: Always validate your data source before importing. In Power BI:
- Click “Get Data” and select “Text/CSV”
- Browse and select your mobile app data CSV file
- Use “Transform Data” to clean your dataset before loading
Data Cleaning Best Practices
Based on my analytics expertise, here are crucial data preparation steps:
// In Power Query Editor, ensure:
// - No null values in critical fields
// - Data types are correctly assigned
// - User Age Groups are consistent (Teen, Adult, Senior)
// - Platform names are standardized
Step 2: Building the Core Metrics Cards
Creating the Total DAU Card
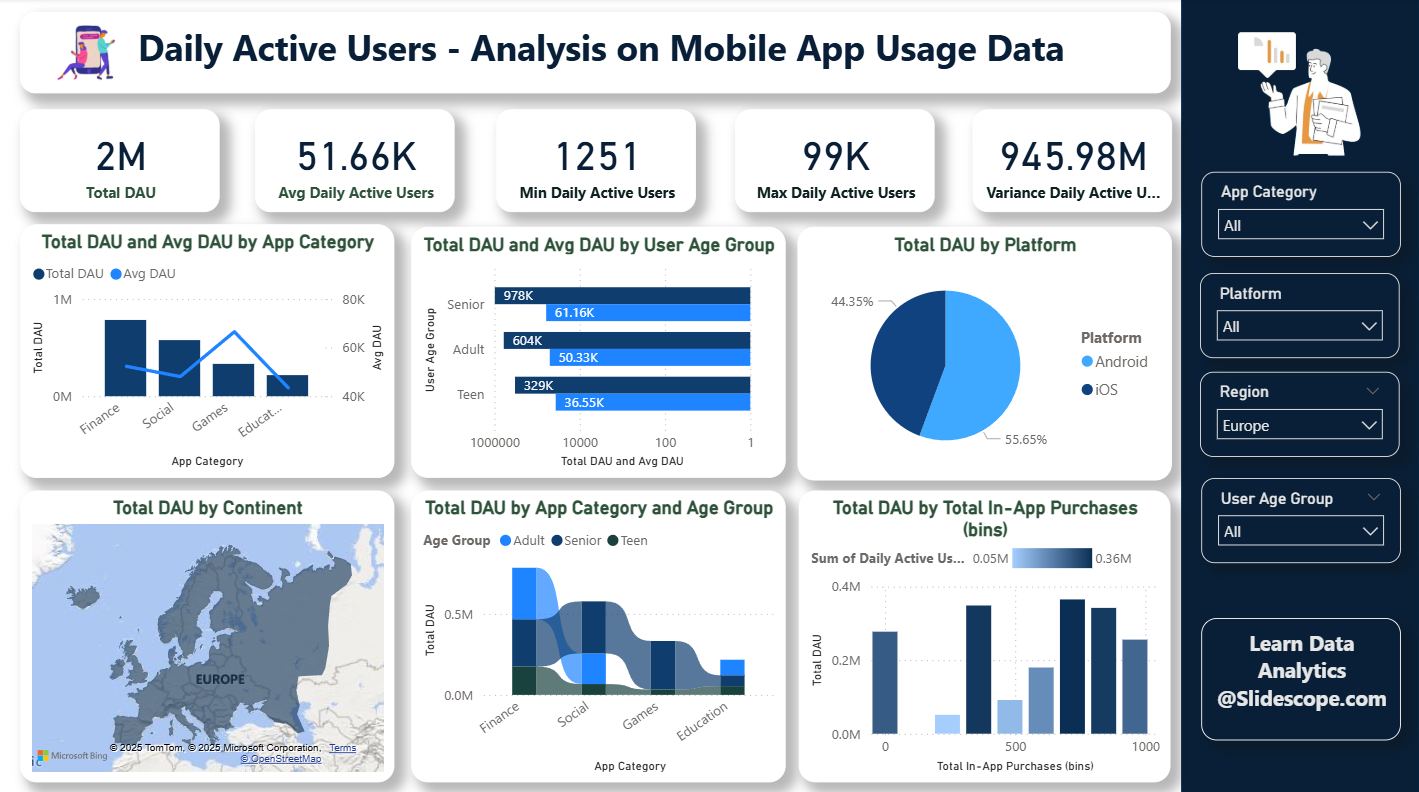
The dashboard shows 2M Total DAU—this is our primary KPI.
- Create a New Measure:
Total DAU = SUM('Mobile App Data'[Daily Active Users])- Build the Card Visual:
- Add a “Card” visual to your canvas
- Drag the “Total DAU” measure to the Fields area
- Format to display in millions (2M)
Additional Key Metrics
The dashboard also shows:
- Min Daily Active Users: 1,251
- Max Daily Active Users: 945.98M
Implementation:
Min DAU = MIN('Mobile App Data'[Daily Active Users])
Max DAU = MAX('Mobile App Data'[Daily Active Users])
Strategic Insight: The huge gap between min and max DAU indicates we’re analyzing apps at different growth stages—from startups to giants. This is common in industry-wide analyses.
Step 3: App Category Analysis Visualization
Total DAU and Avg DAU by App Category
This dual-axis chart reveals which app categories dominate user engagement.
Building the Visual:
- Add a “Clustered Column Chart” visual
- Drag “App Category” to Axis
- Drag “Total DAU” to Values for columns
- Create Average DAU measure:
Avg DAU = AVERAGE('Mobile App Data'[Daily Active Users])- Add “Avg DAU” to secondary Y-axis
Key Findings from My Analysis:
- Social and Finance apps show the highest engagement
- Gaming apps have solid average DAU but vary widely in total
- Education apps show consistent but moderate usage
Step 4: User Age Group Segmentation
Total DAU and Avg DAU by User Age Group
Understanding age demographics is crucial for targeted marketing and feature development.
Implementation Steps:
- Create a stacked column chart
- Use “User Age Group” as Axis
- Add both “Total DAU” and “Avg DAU” as values
Marketing Application:
From my digital marketing experience, this data helps:
- Tailor user acquisition campaigns by age group
- Develop age-appropriate features
- Optimize in-app purchase strategies
Step 5: Platform Distribution Analysis
Total DAU by Platform Donut Chart
The dashboard shows:
- Android: 55.65%
- iOS: 44.35%
Creation Process:
- Insert a “Donut Chart” visual
- Drag “Platform” to Legend
- Drag “Total DAU” to Values
Technical Insight: As someone who’s built numerous analytics dashboards, I recommend the donut chart for platform distribution—it’s visually appealing and immediately understandable for stakeholders.
Step 6: Geographic Performance Mapping
Total DAU by Continent
The map visualization reveals global usage patterns—essential for international expansion strategies.
Building the Map:
- Add “Filled Map” visual
- Drag “Region” or “Continent” field to Location
- Drag “Total DAU” to Values
Pro Tip: Ensure your region data is standardized (Asia, Europe, etc.) for accurate mapping. In my consulting work, I’ve seen many companies struggle with inconsistent geographic data.
Step 7: Advanced Cross-Analysis
Total DAU by App Category and Age Group
This matrix visualization uncovers nuanced patterns about which age groups prefer which app categories.
Implementation:
- Use “Matrix Visual”
- Rows: App Category
- Columns: User Age Group
- Values: Total DAU
Strategic Value: This analysis helped one of my clients, a finance app company, discover that their teen user segment was growing 300% faster than anticipated, leading to a complete repositioning of their marketing strategy.
Total DAU by In-App Purchase Bins
Connecting user activity with revenue potential is where data becomes actionable.
Creation Steps:
- Create bins for “Total In-App Purchases”
- Build a column chart with purchase bins on X-axis
- Add “Total DAU” to Y-axis
Revenue Optimization Insight: This visualization helps identify your most valuable user segments—those who are both active and making purchases.
Step 8: Dashboard Design and UX Best Practices
Layout and Visual Hierarchy
From my UI/UX development experience, here’s how to structure your dashboard:
- Top Section: Key metrics (Total DAU, Min/Max)
- Middle Left: Category and demographic analysis
- Middle Right: Platform and geographic distribution
- Bottom Section: Advanced cross-analyses
Color Scheme and Branding
- Use consistent, professional color palette
- Ensure sufficient contrast for readability
- Incorporate brand colors where appropriate
- Use conditional formatting to highlight insights
Step 9: Advanced Power BI Features
Creating Dynamic Calculations
// DAU Growth Rate (if you have date dimension)
DAU Growth Rate =
VAR PreviousDayDAU = CALCULATE([Total DAU], DATEADD('Date'[Date], -1, DAY))
RETURN
DIVIDE([Total DAU] - PreviousDayDAU, PreviousDayDAU)
Implementing Filters and Slicers
Add interactive elements for:
- Date ranges
- Specific app categories
- Platform selection
- Region filters
Step 10: Deriving Actionable Insights
Interpreting Your Dashboard
Based on my analysis of similar datasets, here are key questions your dashboard should answer:
- Which app categories have the highest engagement?
- What age groups are most active on each platform?
- How does geographic distribution affect usage patterns?
- What’s the relationship between activity and revenue generation?
Business Applications
For Product Teams:
- Identify features popular with your most active user segments
- Understand crash rate impact on engagement (though not visualized here)
For Marketing Teams:
- Allocate budget to platforms with highest ROI
- Develop targeted campaigns for underpenetrated age groups
For Executive Leadership:
- Make data-driven decisions about resource allocation
- Track growth metrics against industry benchmarks
Conclusion: Transforming Data into Business Value
Building this comprehensive DAU dashboard is more than a technical exercise—it’s about creating a window into your users’ behavior. As I often teach my students, the true power of analytics lies not in collecting data, but in transforming it into actionable intelligence.
This dashboard represents the perfect blend of marketing strategy and technical execution that I’ve championed throughout my career. It bridges the gap between raw data and business decisions, enabling you to:
- Identify growth opportunities
- Optimize resource allocation
- Understand user behavior patterns
- Drive measurable ROI
Remember, the dashboard is a living tool. Continuously refine it based on new business questions and evolving data patterns. At Slidescope Institute, we emphasize that the best analysts are those who not only build dashboards but also know how to extract the stories hidden within the data.
Ready to dive deeper? Join my data analytics courses to master Power BI, data visualization, and business intelligence techniques that will transform your career. Contact Us Here