
When it comes to hospitality analytics, every piece of guest data tells a story — who your guests are, how much they spend, how long they stay, and how satisfied they feel. To demonstrate how businesses can unlock insights from hotel guest data, I created this Hotel Guests Stays Data – Exploratory Dashboard in Excel.’
This tutorial explains exactly how I built it step by step, from raw data to final visuals. The dataset has the following columns:
- Guest_ID – Unique identifier for each guest stay
- Nights_Stayed – Duration of stay
- Room_Fare – Cost of booking (USD)
- Additional_Spend – Non-room revenue (spa, food, events, etc.)
- Guest_Age – Demographics segmentation
- Room_Type – Single, Double, Suite, Deluxe
- Booking_Channel – OTA, Direct, Corporate, Walk-in
- Country – Guest origin
- Feedback_Rating – Guest satisfaction score
The goal: Turn this into a business-ready dashboard to track guest behavior, revenues, and satisfaction.
Get the Hotel Stays Guests Demographic Dataset
Step 1 – Organize and Convert Data into a Table
First, I cleaned the dataset and converted it into an Excel Table (Ctrl + T). This ensures dynamic ranges and structured references, which are critical for building interactive dashboards.
Step 2 – Build the Core PivotTables
I inserted several PivotTables from the dataset to compute key metrics:
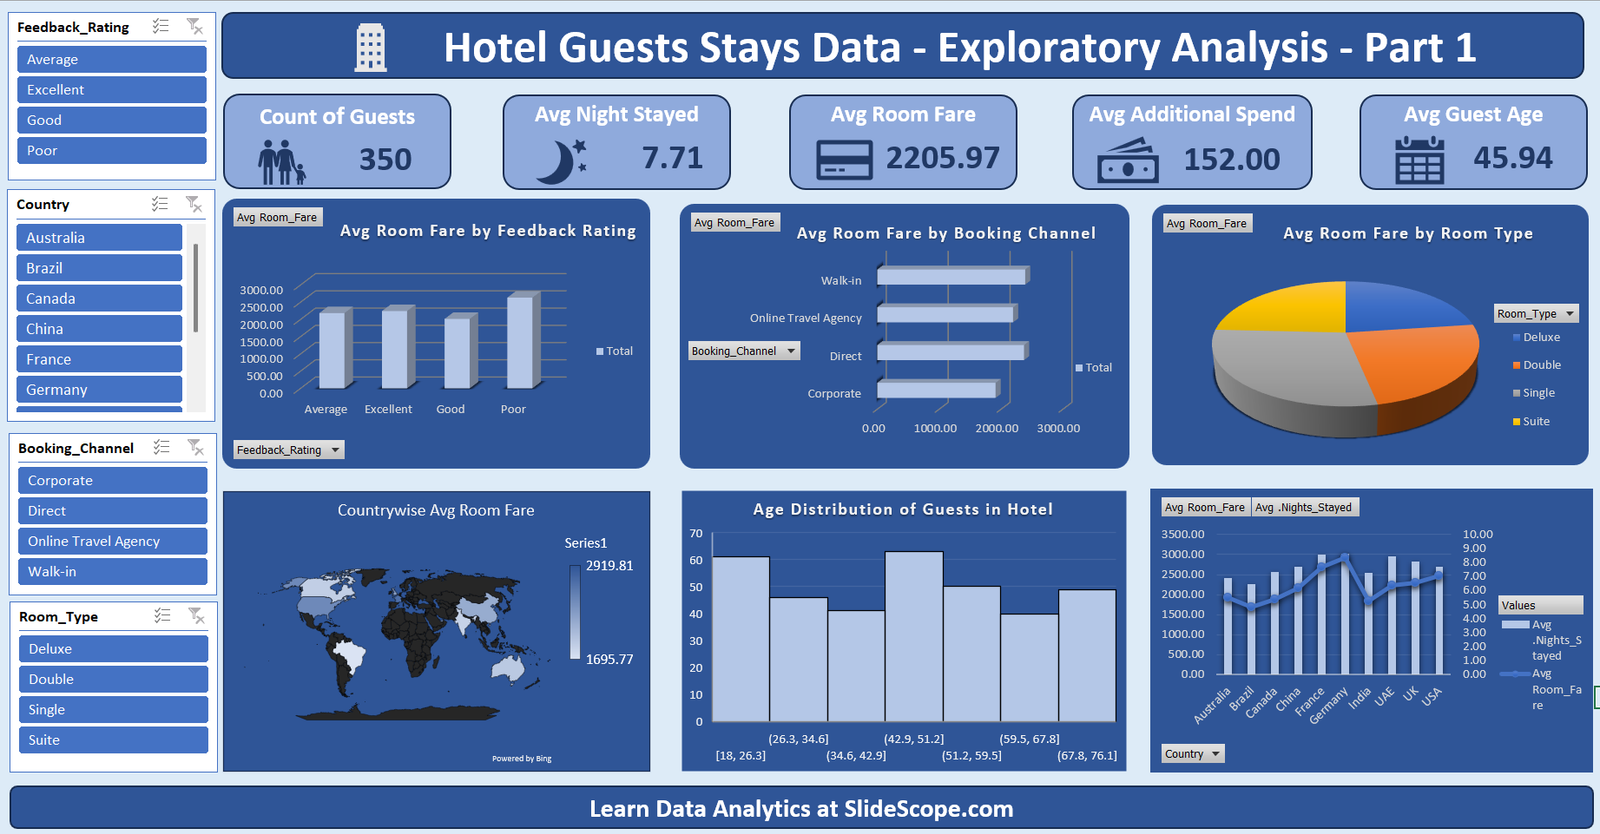
- Count of Guests → Count of
Guest_ID - Average Nights Stayed → Average of
Nights_Stayed - Average Room Fare → Average of
Room_Fare - Average Additional Spend → Average of
Additional_Spend - Average Guest Age → Average of
Guest_Age
These became the foundation for the KPI cards at the top of the dashboard.
Step 3 – Add KPI Cards
Using PivotTable outputs (linked with GETPIVOTDATA), I created large KPI cards with icons for:
- Guests Count
- Avg Night Stayed
- Avg Room Fare
- Avg Additional Spend
- Avg Guest Age
Shaping these with background rectangles and bold numbers made them dashboard-friendly.
Step 4 – Create PivotCharts for Exploratory Analysis
- Avg Room Fare by Feedback Rating
- Inserted PivotTable with
Feedback_Ratingin rows andRoom_Fare(Average) in values. - Used a 3D Column Chart for better visual impact.
- Inserted PivotTable with
- Avg Room Fare by Booking Channel
- Pivot with
Booking_Channelin rows andRoom_Farein values. - Used a Bar Chart for comparison across channels.
- Pivot with
- Avg Room Fare by Room Type
- Pivot with
Room_Typein rows andRoom_Farein values. - Converted into a Pie Chart to show distribution across room preferences.
- Pivot with
- Countrywise Avg Room Fare (Map Chart)
- Challenge: Map charts are not supported directly from PivotTables.
- Solution: Created a helper table with
CountryandAvg Room FareusingGETPIVOTDATA. - Inserted a Map Chart, then right-click → Select Data → pointed to helper table.
- Now the Map updates dynamically when slicers are applied.
- Age Distribution of Guests (Histogram)
- Challenge: PivotTables don’t directly support Histograms.
- Solution: Created bins for ages using
FREQUENCYor Pivot grouping. - Built a Histogram chart manually by selecting helper ranges, then linked it with slicer-controlled data.
- Combined Chart – Avg Room Fare vs Avg Nights Stayed by Country
- Pivot with
Countryin rows and bothRoom_FareandNights_Stayedas values. - Inserted a Combo Chart (Column for Room Fare, Line for Nights Stayed).
- Pivot with
Step 5 – Add Interactivity with Slicers
I inserted slicers for:
- Feedback Rating
- Country
- Booking Channel
- Room Type
Linked slicers to all PivotTables (via Report Connections) so filters apply across the entire dashboard. Now, selecting “Excellent” feedback or “France” instantly updates all KPIs and charts.
Step 6 – Style the Dashboard
- Applied a consistent dark blue theme for professional look.
- Removed gridlines and unnecessary chart elements.
- Used modern icons for KPIs (Guest, Moon, Credit Card, Wallet, Calendar).
- Added a footer CTA: “Learn Data Analytics at SlideScope.com”
Step 7 – Test and Validate
Finally, I tested slicers, checked for alignment, and validated calculations. For example: selecting Direct Booking + Excellent Feedback shows how much premium guests are spending compared to OTA bookings.
Why This Dashboard Works for Hotels
- Revenue Insight → Room fare vs channel helps identify profitable distribution.
- Customer Segmentation → Age distribution and feedback help design loyalty programs.
- Global Reach → Map chart shows which countries bring in high-value guests.
- Experience vs Spend → Feedback vs spend correlation guides service improvements.
Key Excel Trick Recap
- Map and Histogram → Not directly possible with PivotTables, so I built them using helper tables and then linked ranges dynamically.
- Combo Chart → Perfect to show multi-metric comparisons (Room Fare vs Nights).
- Slicers → Ensure dashboard-wide interactivity.
Final Words by Ankit Sir
This dashboard demonstrates how even Excel (without Power BI) can serve as a powerful exploratory analysis tool for hospitality businesses. By combining PivotTables, helper tables, slicers, and creative charting techniques, we can turn raw hotel data into actionable insights.
👉 Want to build dashboards like this?
Learn Data Analytics at SlideScope.com