
We are continuing our discussion from previous part (Click Here) and here we will create 10 more measures to use in the report.
For each one, I’ll explain what it is, the DAX, and why a CFO cares.
Below are 10 advanced yet practical DAX measures that CFOs and FP&A teams actually use on KPI cards and visuals, excluding what we’ve already covered (Revenue, Expense, Net Profit, Cash Flow, ROI).
1️⃣ Gross Margin %
DAX
Gross Margin % =
DIVIDE(
    [Net Profit],
    [Total Revenue],
    BLANK()
)
Why CFOs Use It
Shows profit efficiency, not just profit size.
A CFO insight:
“Revenue is growing, but margin is shrinking — costs are rising faster than sales.”
Perfect for KPI cards and trend lines.
2️⃣ Operating Cost Ratio
DAX
Operating Cost Ratio % =
DIVIDE(
    [Total Expense],
    [Total Revenue],
    BLANK()
)
Why CFOs Use It
Answers:
“How much does it cost us to earn ₹1 or $1?”
Lower ratio = higher operational efficiency.
3️⃣ Revenue Growth % (Month-over-Month)
DAX
Revenue MoM % =
DIVIDE(
    [Total Revenue] - CALCULATE([Total Revenue], PREVIOUSMONTH('Financial_Transactions'[Date])),
    CALCULATE([Total Revenue], PREVIOUSMONTH('Financial_Transactions'[Date])),
    BLANK()
)
Why CFOs Use It
Tracks momentum, not absolute numbers.
CFOs watch this closely for:
- Early slowdown signals
- Sales effectiveness
4️⃣ Expense Growth % (Cost Inflation Indicator)
DAX
Expense MoM % =
DIVIDE(
    [Total Expense] - CALCULATE([Total Expense], PREVIOUSMONTH('Financial_Transactions'[Date])),
    CALCULATE([Total Expense], PREVIOUSMONTH('Financial_Transactions'[Date])),
    BLANK()
)
Why CFOs Use It
Identifies cost creep before it hits margins.
If expense growth > revenue growth → red flag.
5️⃣ EBITDA (Simplified CFO View)
DAX
EBITDA =
[Net Profit]
In this dataset, interest, tax, depreciation are already embedded at high level.
This simplified EBITDA is valid for executive dashboards.
Why CFOs Use It
Investors, banks, and boards compare companies using EBITDA.
6️⃣ Cost Contribution % by Department
DAX
Department Cost % =
DIVIDE(
    [Total Expense],
    CALCULATE([Total Expense], ALL('Financial_Transactions'[Department])),
    BLANK()
)
Why CFOs Use It
Shows:
“Which departments consume the largest share of company costs?”
Excellent for pie or bar charts.
7️⃣ Revenue Concentration %
DAX
Revenue Concentration % =
DIVIDE(
    [Total Revenue],
    CALCULATE([Total Revenue], ALL('Financial_Transactions'[Revenue_Stream])),
    BLANK()
)
Why CFOs Use It
Measures dependency risk.
If one revenue stream contributes 70% → strategic risk.
8️⃣ Average Monthly Burn Rate
DAX
Average Burn Rate =
AVERAGEX(
    VALUES('Financial_Transactions'[Month]),
    [Total Expense]
)
Why CFOs Use It
Critical for:
- Startups
- Cash runway planning
- Fundraising conversations
9️⃣ Cost per Project
DAX
Cost per Project =
DIVIDE(
    [Total Expense],
    DISTINCTCOUNT('Financial_Transactions'[Project]),
    BLANK()
)
Why CFOs Use It
Evaluates:
“Are we spreading our capital too thin?”
Helps rationalize project portfolios.
🔟 Profit Volatility (Risk Indicator)
DAX
Profit Volatility =
STDEVX.P(
    VALUES('Financial_Transactions'[Month]),
    [Net Profit]
)
Why CFOs Use It
High volatility = financial instability.
CFOs prefer:
- Predictable profits
- Controlled variance
🧠 How These KPIs Fit Your Dashboards
| Dashboard | Best KPIs |
|---|---|
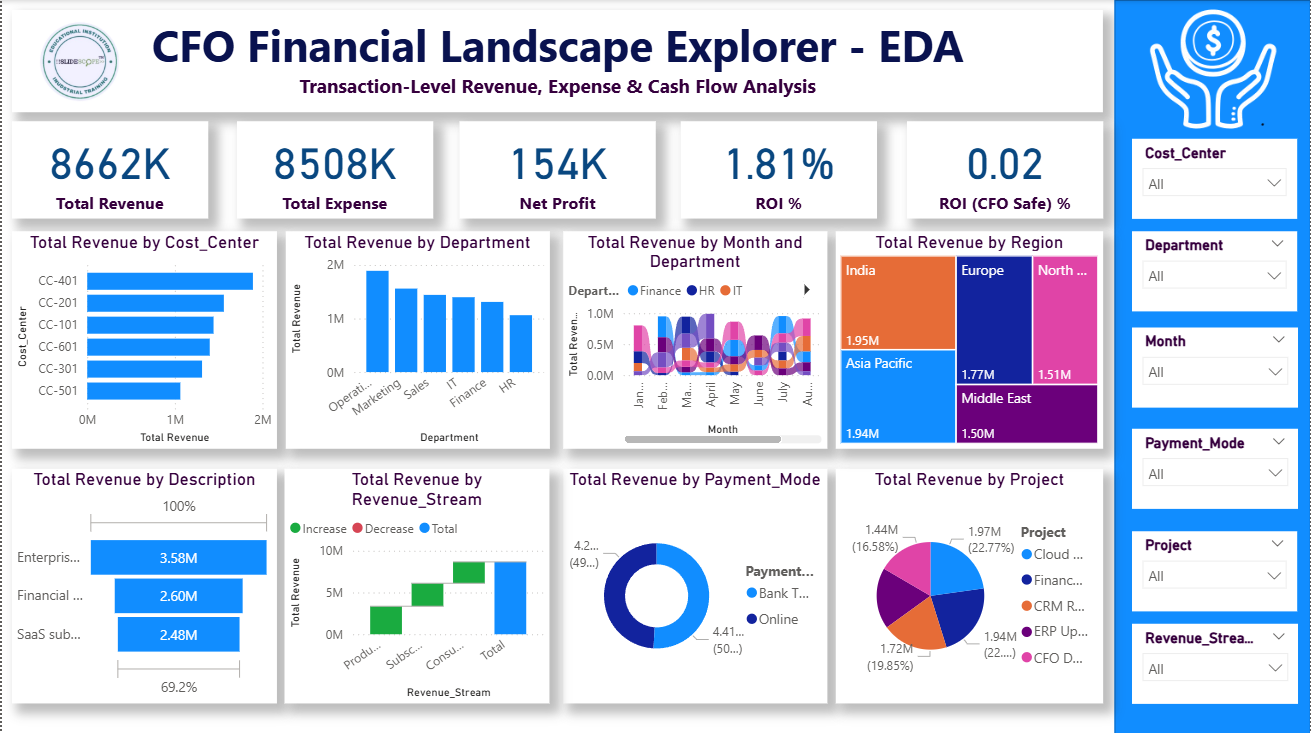
| CFO Financial Landscape Explorer | Gross Margin %, Cost Ratio, Profit Volatility |
| CFO Profit Command Center | EBITDA, Margin %, Revenue Growth |
| CFO Cash Flow Dashboard | Burn Rate, Expense Growth |
| CFO ROI Dashboard | Cost per Project, Revenue Concentration |
| CFO Strategy Dashboard | Department Cost %, Profit Volatility |
💡 Pro-Level Tip (Use This Line Publicly)
“CFO dashboards focus on efficiency, sustainability, and risk, not just revenue growth.”
This line alone positions you as senior BI + finance.