
Introduction
In today’s data-driven world, organizations rely heavily on data analytics to make strategic decisions, optimize operations, and understand customer behavior. From startups to global enterprises, companies are constantly searching for professionals who can transform raw data into meaningful insights. This growing demand has made data analytics one of the most promising and high-paying career paths globally.
However, becoming a successful data analyst is not just about understanding numbers; it requires mastering the right tools and technologies used across the industry. Modern data analytics involves data collection, cleaning, processing, visualization, and predictive analysis. To perform these tasks efficiently, analysts depend on powerful software and programming tools that help extract insights from massive datasets.
As someone working in the IT training and digital analytics space, I have observed that professionals who master the right analytics tools significantly increase their career opportunities and salary potential. Companies are willing to pay premium salaries to candidates who are proficient in tools like SQL, Python, Power BI, Tableau, and Excel because these tools directly contribute to business intelligence and decision-making.
In this article, I will walk you through the Top 10 Data Analytics Tools you must learn if you want to build a successful career in data analytics and secure high-paying jobs in 2026 and beyond. Whether you are a beginner, student, or working professional, mastering these tools can transform your career and open doors to global opportunities.
1. Microsoft Excel
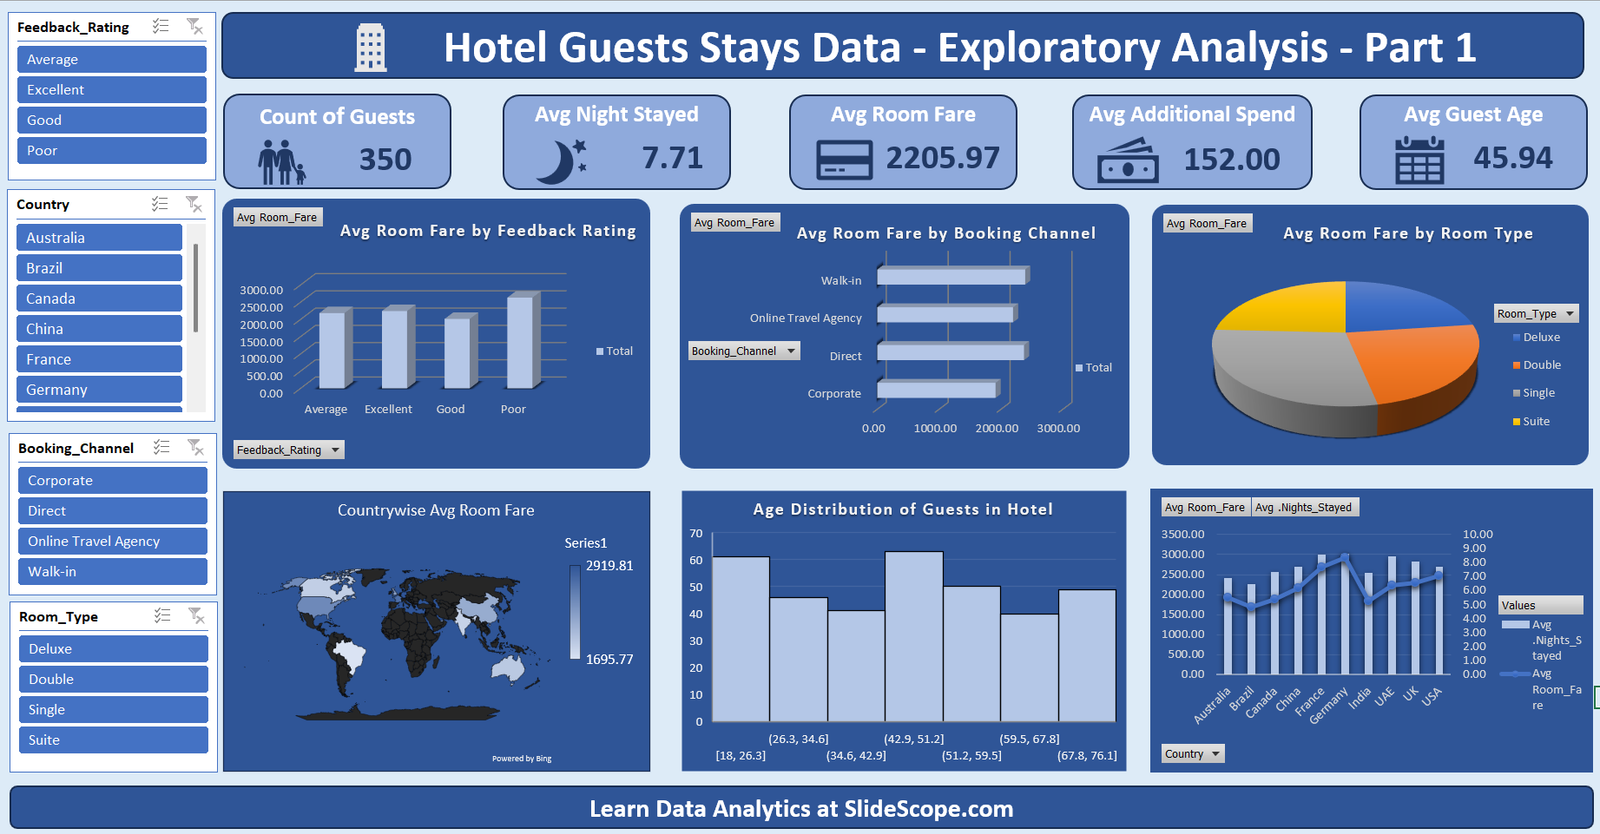
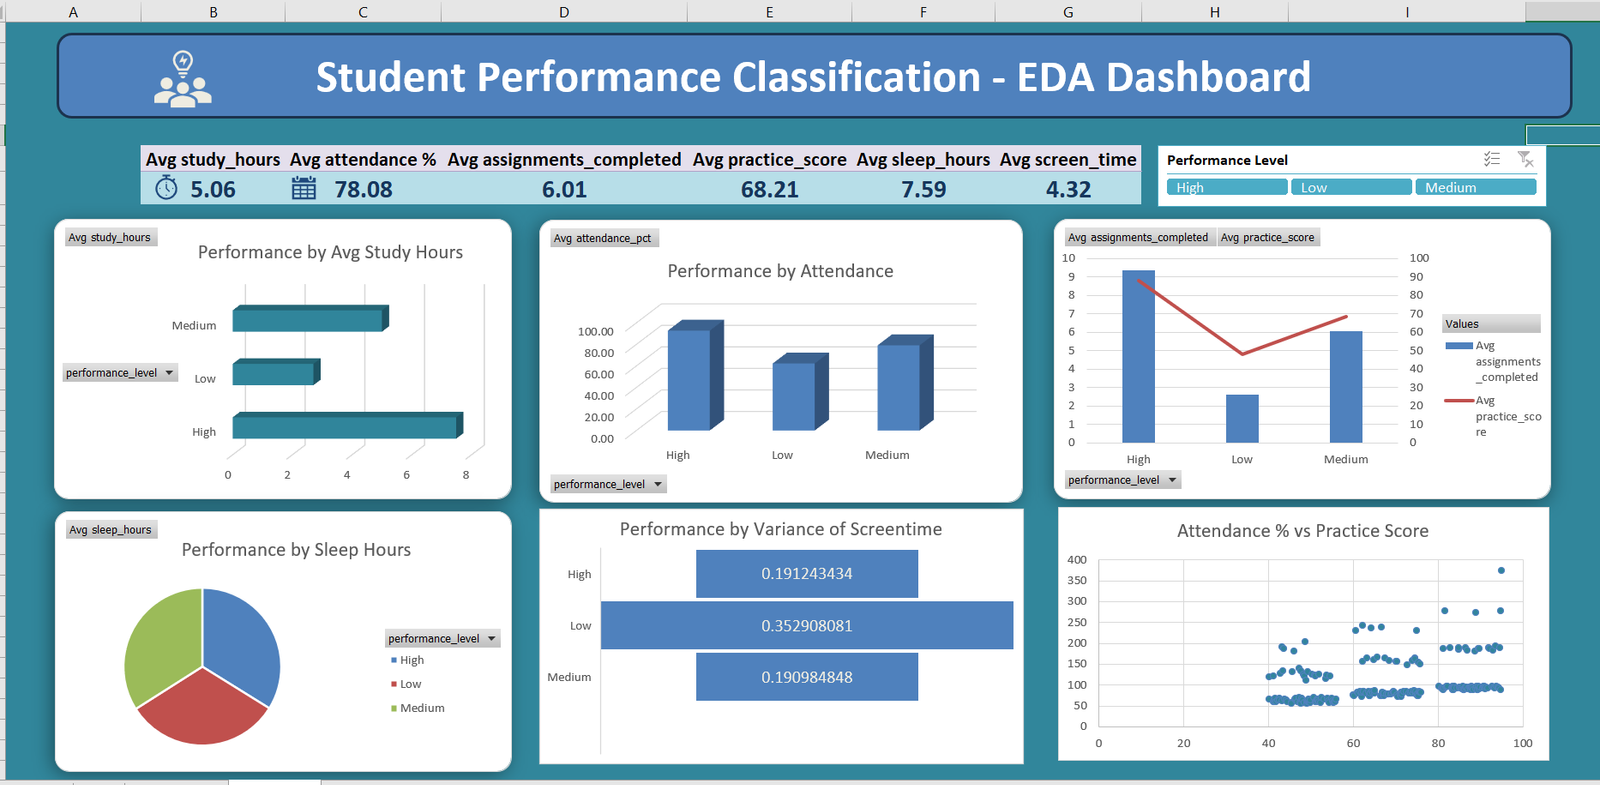
Microsoft Excel remains one of the most widely used data analytics tools in the world. Despite the rise of advanced analytics platforms, Excel continues to be the foundation of data analysis in many organizations. Its versatility, ease of use, and powerful functions make it an essential tool for beginners and experienced analysts alike.
Excel allows analysts to perform tasks such as data cleaning, filtering, sorting, and visualization. Features like Pivot Tables, Power Query, conditional formatting, and advanced formulas help transform raw datasets into meaningful reports. Analysts frequently use functions such as VLOOKUP, INDEX-MATCH, SUMIFS, and COUNTIFS to analyze and manipulate large datasets efficiently.
Another powerful capability of Excel is its ability to integrate with other tools like Power BI, SQL databases, and cloud platforms. Many businesses still maintain large datasets in Excel spreadsheets, making it important for analysts to understand how to manage and analyze spreadsheet-based data.
Excel also includes Power Pivot and Power Query, which extend its capabilities into more advanced data modeling and transformation tasks. These features allow users to connect multiple datasets and perform complex analysis without needing programming knowledge.
For beginners entering the field of data analytics, Excel is often the first tool they learn because it builds the foundation for understanding data structures and analysis techniques. Even experienced data scientists still rely on Excel for quick exploratory analysis.
Because of its universal adoption across industries such as finance, marketing, healthcare, and operations, Excel remains one of the most important tools every data analyst must master.
2. SQL (Structured Query Language)


SQL is one of the most critical skills for data analysts because it allows professionals to communicate directly with databases. Most organizations store their data in relational databases such as MySQL, PostgreSQL, SQL Server, or Oracle. SQL enables analysts to retrieve, manipulate, and analyze this data efficiently.
With SQL, analysts can write queries to extract specific information from large datasets. Commands such as SELECT, WHERE, GROUP BY, JOIN, and ORDER BY allow users to filter and organize data based on business requirements. Analysts also use SQL for aggregating data, calculating metrics, and generating reports.
One of the most powerful features of SQL is the ability to join multiple tables together. Businesses often store data across different tables—for example, customer data, product data, and transaction data. Using SQL joins, analysts can combine these datasets to uncover valuable insights about customer behavior or sales performance.
SQL is widely used in business intelligence, finance, marketing analytics, and product analytics roles. Many companies consider SQL proficiency a mandatory requirement for data analyst positions because it allows professionals to work directly with raw data stored in enterprise databases.
Another advantage of SQL is that it integrates seamlessly with tools like Power BI, Tableau, Python, and R. Analysts often use SQL to extract data from databases and then visualize or analyze it using other analytics platforms.
Because nearly every company relies on databases to store operational data, SQL remains one of the most valuable and high-demand skills for data analytics professionals.
3. Python
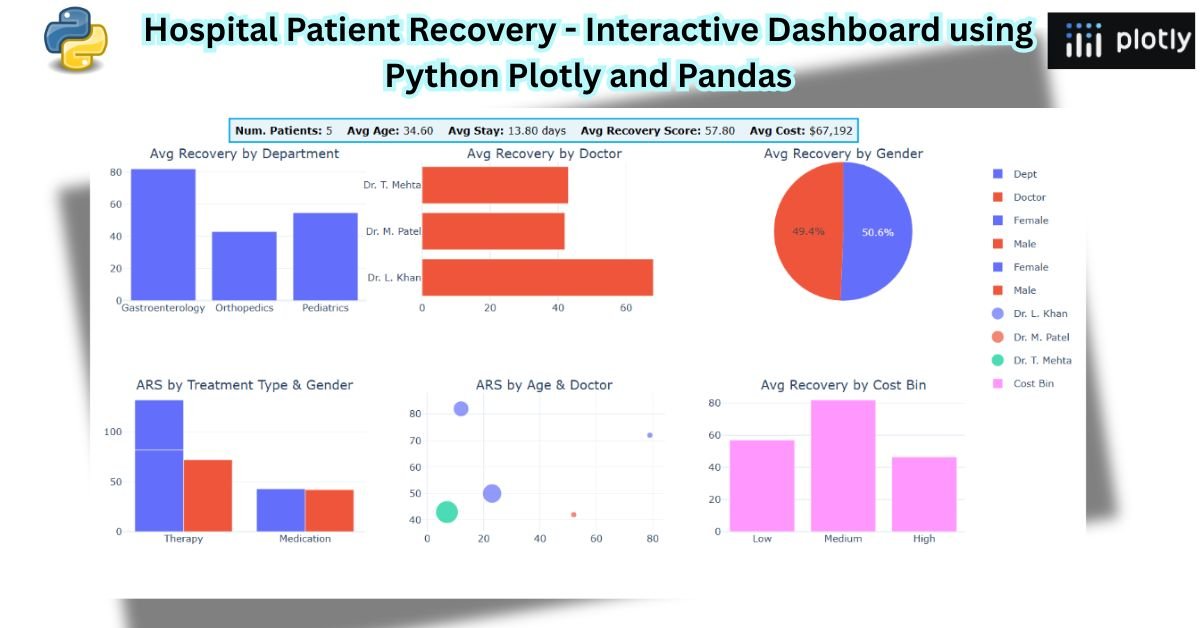
Python has become one of the most powerful and widely used programming languages in the field of data analytics and data science. Its simplicity, flexibility, and strong community support make it a preferred language for professionals working with data.
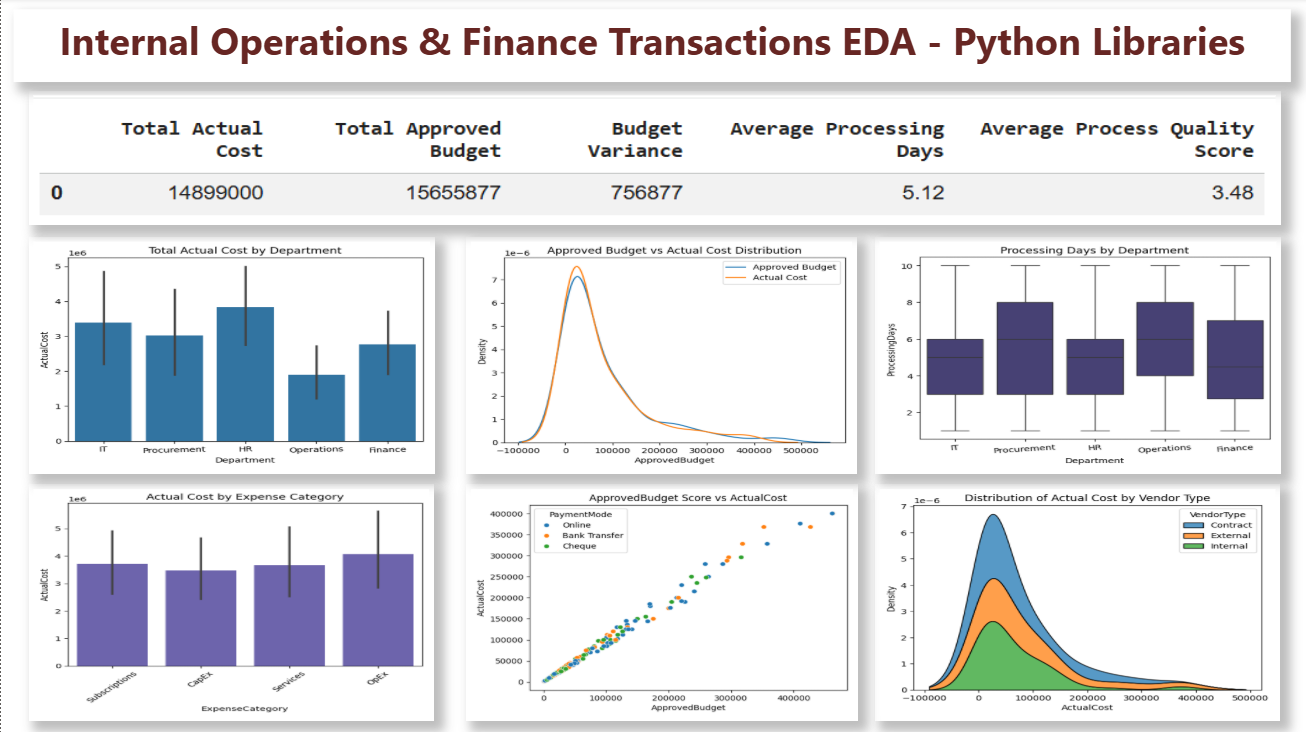
Python provides powerful libraries specifically designed for data analysis. Libraries such as Pandas, NumPy, Matplotlib, and Seaborn allow analysts to manipulate, process, and visualize complex datasets efficiently. Pandas, in particular, is widely used for data cleaning, transformation, and analysis.
Another major advantage of Python is its ability to handle large datasets and automate repetitive data processing tasks. Analysts can write scripts to clean data, merge datasets, perform calculations, and generate reports automatically. This automation significantly increases productivity and reduces manual work.
Python is also widely used for machine learning and predictive analytics. Libraries like Scikit-learn, TensorFlow, and PyTorch allow analysts to build predictive models that help businesses forecast trends and make smarter decisions.
In addition, Python integrates seamlessly with data visualization tools and big data platforms. Analysts can connect Python to databases, APIs, and cloud services to collect and analyze real-time data.
Because of its versatility and strong industry adoption, Python is often considered a must-learn skill for anyone pursuing a career in data analytics, data science, or artificial intelligence.
4. Power BI
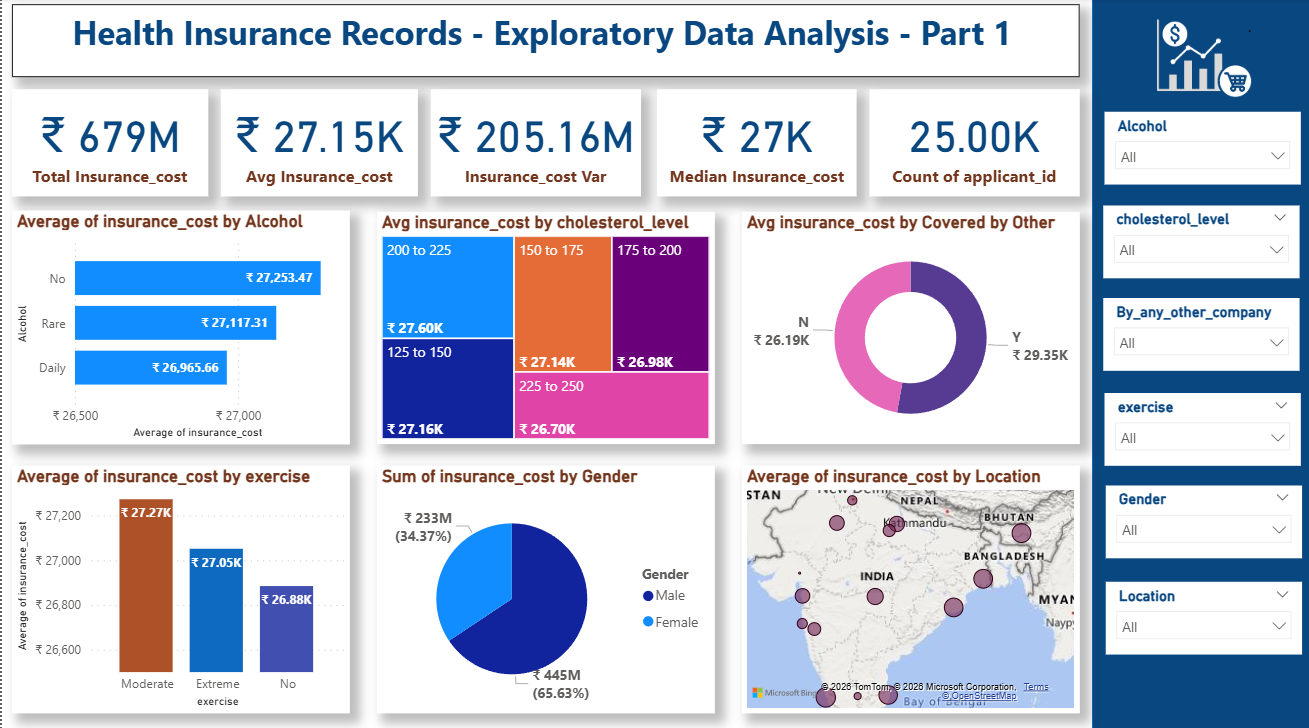

Power BI is a powerful business intelligence and data visualization tool developed by Microsoft. It enables analysts to transform raw data into interactive dashboards and visual reports that help organizations make data-driven decisions.
One of the key strengths of Power BI is its ability to connect with multiple data sources. Analysts can import data from Excel files, SQL databases, cloud platforms, APIs, and enterprise systems. This flexibility allows organizations to consolidate data from different departments into a single analytics platform.
Power BI includes powerful features such as Power Query for data transformation and DAX (Data Analysis Expressions) for advanced calculations. These capabilities allow analysts to create complex data models and generate meaningful insights from large datasets.
Interactive dashboards are another major advantage of Power BI. Users can explore data visually using charts, graphs, filters, and slicers. Decision-makers can quickly identify trends, patterns, and anomalies without needing technical expertise.
Power BI is widely used in industries such as finance, healthcare, retail, and supply chain management. Many organizations rely on Power BI dashboards to track key performance indicators (KPIs) and monitor business performance in real time.
Because of its growing popularity and strong integration with Microsoft tools, Power BI has become one of the most valuable skills for modern data analysts.
5. Tableau
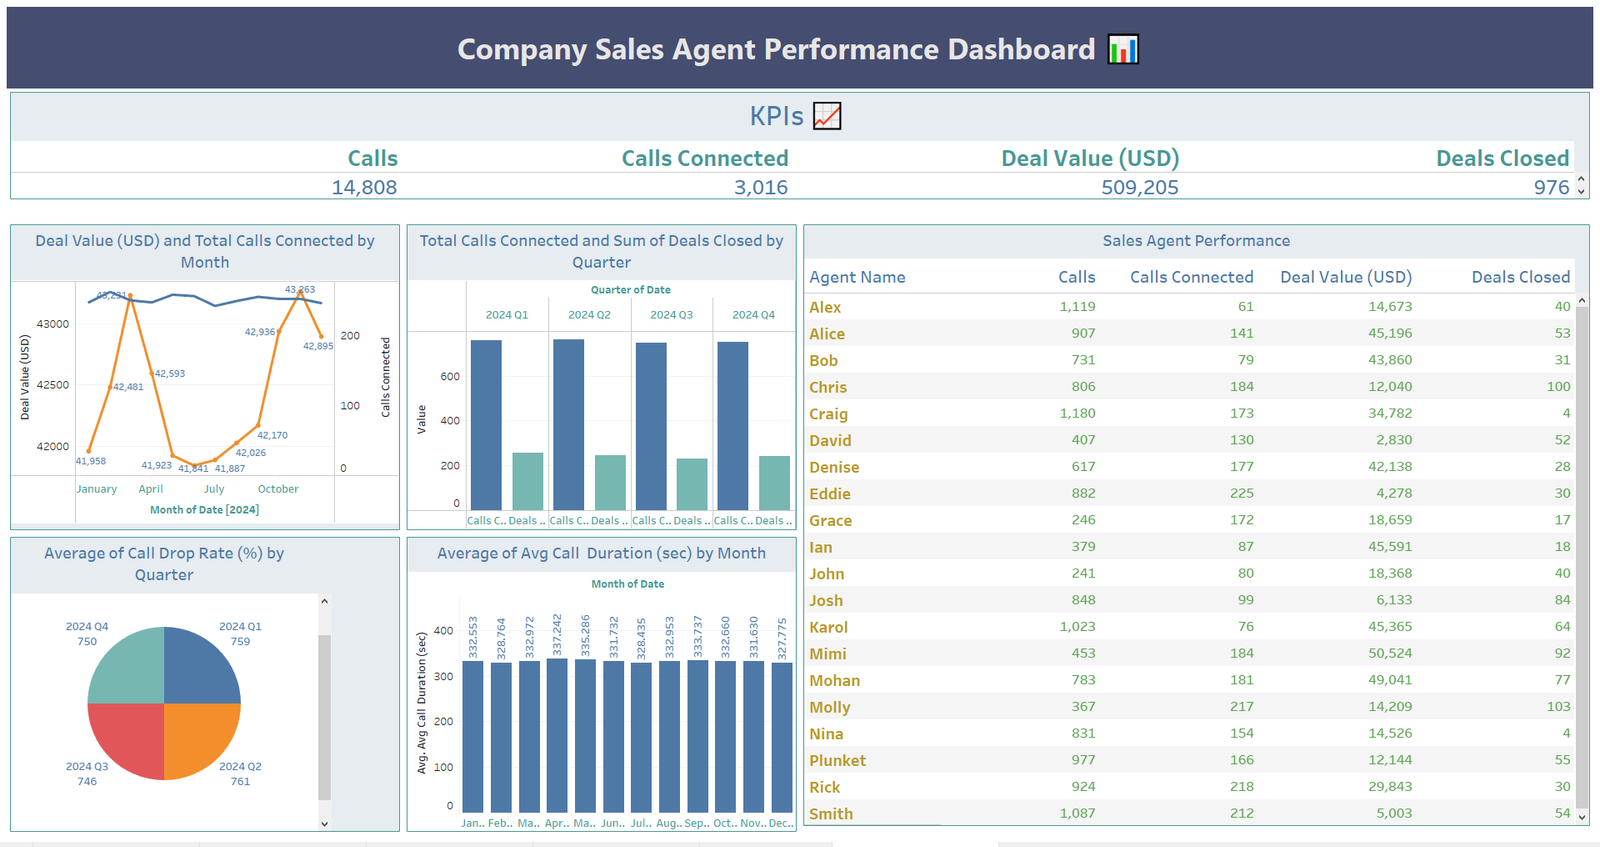
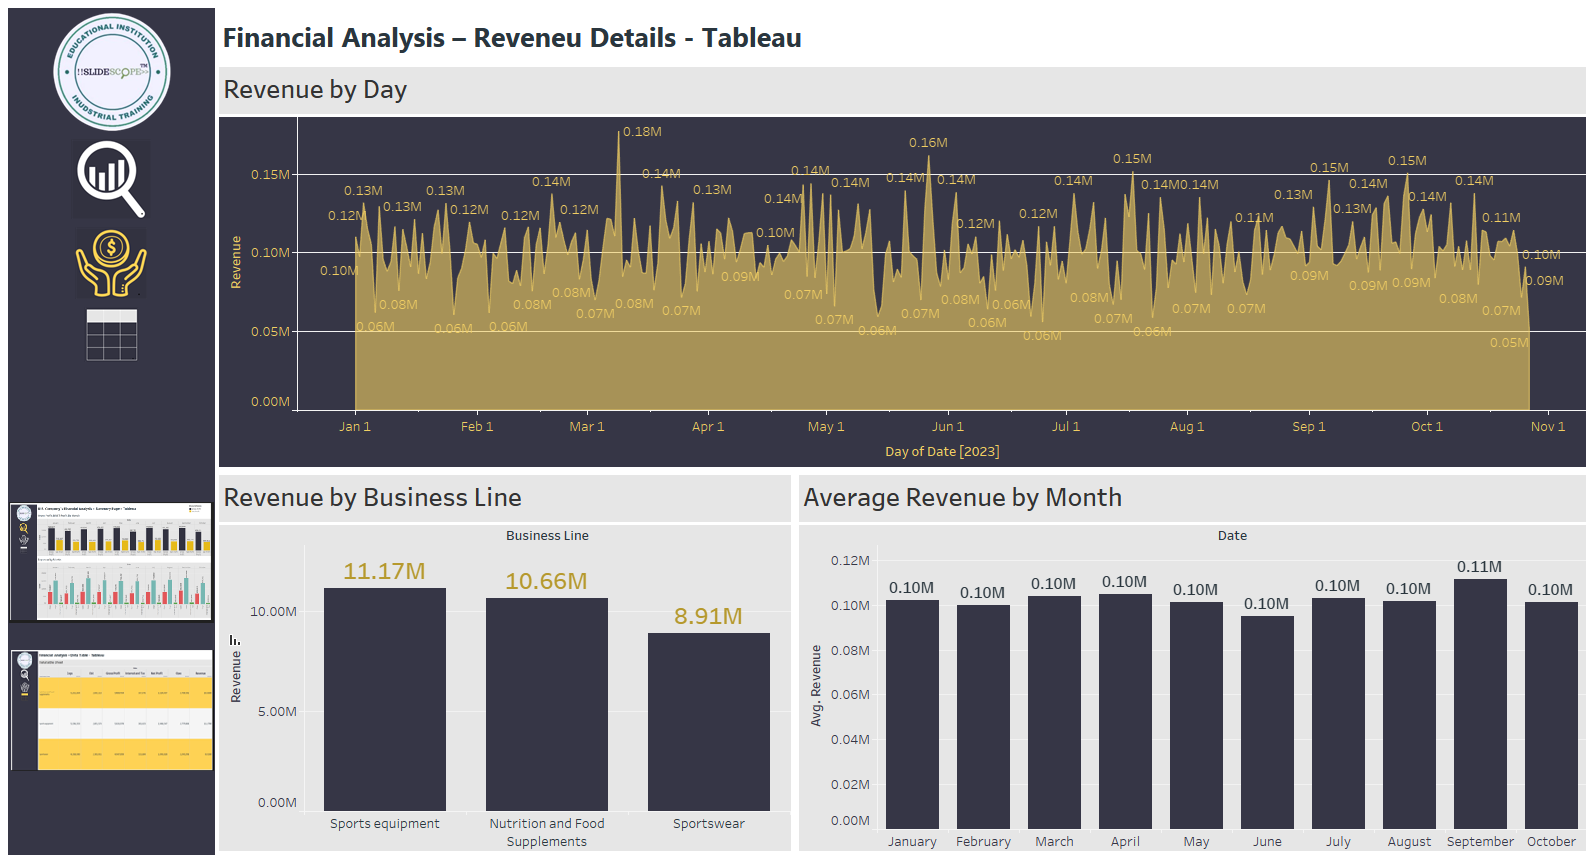
Tableau is one of the most advanced and widely used data visualization tools in the analytics industry. It enables analysts to create powerful visual dashboards that help organizations understand complex datasets quickly.
Tableau’s drag-and-drop interface makes it easy to build interactive visualizations without extensive programming knowledge. Analysts can create charts, maps, and graphs that reveal trends, patterns, and correlations within data.
One of the biggest advantages of Tableau is its speed and performance when working with large datasets. It can process millions of records and generate visual insights in seconds, making it ideal for enterprise-level analytics.
Tableau also supports advanced analytics features such as predictive modeling, statistical analysis, and geospatial visualization. Analysts can combine multiple datasets and create sophisticated dashboards that provide deeper insights into business operations.
Another major benefit of Tableau is its strong community and learning ecosystem. Thousands of professionals share dashboards, tutorials, and best practices online, making it easier for beginners to learn and improve their skills.
Because businesses increasingly rely on visual data storytelling to support decision-making, Tableau remains one of the most valuable tools for data analysts and business intelligence professionals.
6. R Programming
R is a powerful programming language specifically designed for statistical analysis and data visualization. It is widely used by statisticians, data scientists, and researchers for analyzing complex datasets.
One of the key strengths of R is its extensive collection of packages for statistical computing. Libraries such as ggplot2, dplyr, and tidyr enable analysts to perform advanced statistical analysis and create high-quality visualizations.
R is particularly popular in fields such as finance, healthcare research, and academic data analysis because it provides strong support for statistical modeling and predictive analytics.
Another advantage of R is its ability to handle large datasets and perform complex mathematical calculations. Analysts can use R to build regression models, perform hypothesis testing, and analyze time-series data.
R also integrates with tools such as Python, SQL, and big data platforms like Hadoop and Spark, making it a versatile tool in modern analytics environments.
For professionals interested in advanced analytics and statistical modeling, learning R can significantly enhance their analytical capabilities and career opportunities.
7. Apache Spark
Apache Spark is a powerful big data processing framework used for analyzing massive datasets quickly and efficiently. It is widely used by companies that handle large volumes of data generated from applications, sensors, and online platforms.
Spark is designed for distributed computing, meaning it can process data across multiple machines simultaneously. This allows organizations to analyze huge datasets much faster than traditional data processing systems.
Spark supports multiple programming languages including Python, Scala, Java, and R. Analysts can use Spark to perform data processing, machine learning, and real-time analytics.
Another advantage of Spark is its compatibility with big data storage systems such as Hadoop and cloud platforms like AWS and Azure. This makes it a key tool in modern big data ecosystems.
Companies such as Netflix, Uber, and Amazon rely heavily on Spark for large-scale data processing and analytics. Professionals who understand Spark are highly valued in big data and data engineering roles.
8. SAS
SAS (Statistical Analysis System) is a powerful analytics software widely used in industries such as healthcare, banking, and finance. It provides advanced statistical analysis, predictive modeling, and data management capabilities.
One of the major strengths of SAS is its reliability and accuracy when handling sensitive and regulated data. Many financial institutions and government agencies use SAS for risk analysis and compliance reporting.
SAS also provides strong tools for data visualization and predictive analytics. Analysts can use SAS to build statistical models that help organizations forecast trends and identify potential risks.
Although newer tools like Python and R have gained popularity, SAS remains an important tool in industries that require strong statistical accuracy and regulatory compliance.
9. Google Analytics
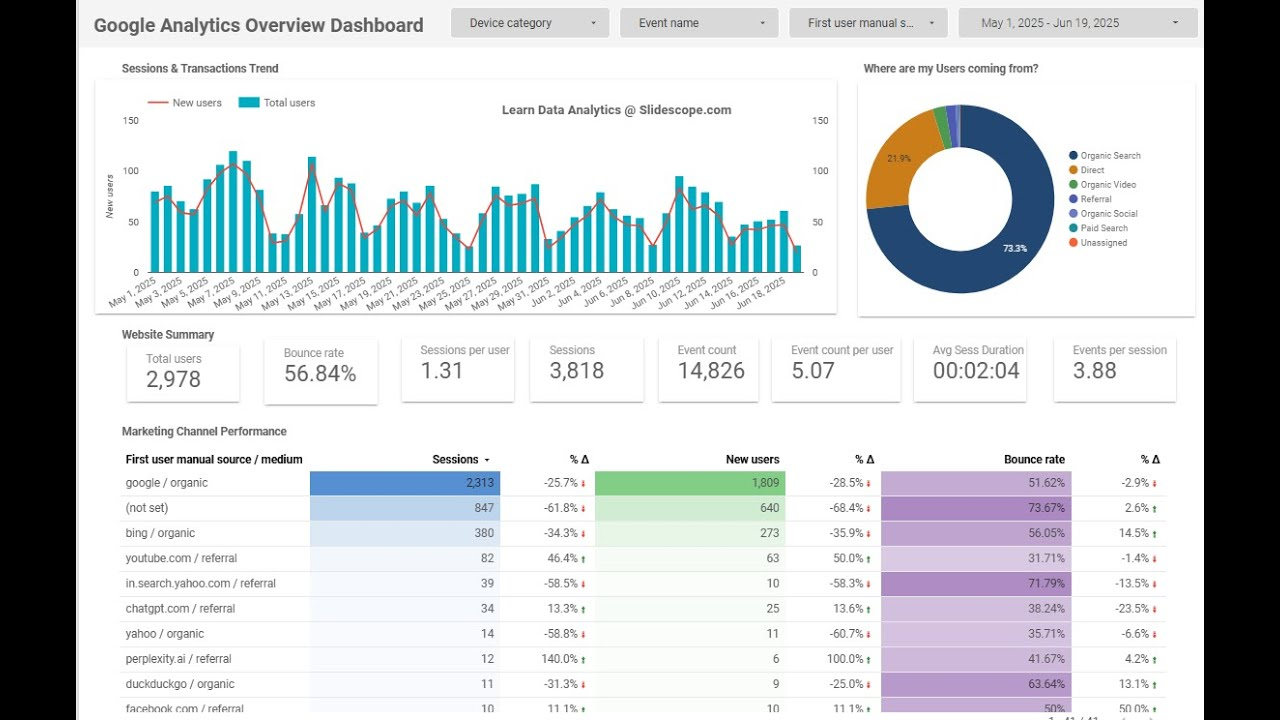
Google Analytics is one of the most widely used tools for analyzing website and digital marketing data. It helps businesses understand how users interact with their websites and digital platforms.
With Google Analytics, analysts can track metrics such as website traffic, user behavior, conversion rates, and marketing campaign performance. These insights help businesses optimize their digital strategies and improve customer engagement.
Google Analytics also integrates with advertising platforms such as Google Ads, enabling marketers to measure the effectiveness of their campaigns.
For professionals working in digital marketing and product analytics, Google Analytics is an essential tool for understanding online user behavior and performance metrics.
10. Jupyter Notebook
Jupyter Notebook is an interactive development environment widely used for data analysis, machine learning, and scientific computing. It allows analysts to write code, visualize data, and document their analysis in a single environment.
One of the biggest advantages of Jupyter Notebook is its ability to combine code, text, and visualizations in one document. This makes it ideal for collaborative projects and data storytelling.
Analysts often use Jupyter Notebook with Python libraries such as Pandas, NumPy, and Matplotlib to explore datasets and build predictive models.
Because of its flexibility and ease of use, Jupyter Notebook has become a standard tool in data science and analytics workflows.
Conclusion
The demand for data analytics professionals is growing rapidly as organizations across industries continue to rely on data-driven decision-making. Companies are actively seeking skilled analysts who can extract valuable insights from data and transform them into strategic business actions.
Learning the right data analytics tools is the key to building a successful and high-paying career in this field. Tools such as Excel, SQL, Python, Power BI, Tableau, and Spark enable analysts to process large datasets, visualize insights, and support business decisions effectively.
However, mastering these tools is not just about technical knowledge—it also requires understanding how to apply analytics to solve real-world business problems. Professionals who combine strong analytical thinking with expertise in modern data tools will always remain in high demand.
If you are planning to build a career in data analytics, start by learning these tools step by step and practice them with real-world datasets and projects. With the right skills and consistent learning, you can unlock exciting career opportunities in data analytics and secure high-paying roles in the global technology industry.