
10 Key Points to Consider While Creating an Effective Financial Analysis Dashboard
Hello, I am Ankit Srivastava, a Data Analytics Professional passionate about transforming complex data into meaningful insights that help businesses […]
Hello, I am Ankit Srivastava, a Data Analytics Professional passionate about transforming complex data into meaningful insights that help businesses […]
Introduction In today’s data-driven world, organizations rely heavily on data analytics to make strategic decisions, optimize operations, and understand customer
In today’s competitive environment, supply chains are no longer just operational backbones — they are strategic differentiators. The difference between
Step-by-Step Data Analysis with Seaborn By Ankit Srivastava In this tutorial, I will guide you step by step on how
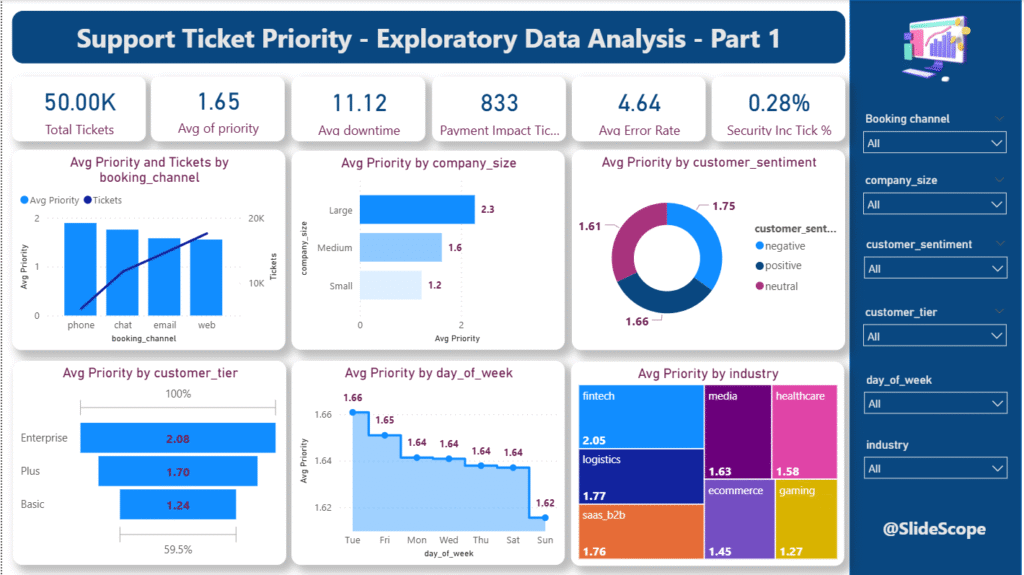
The Support Ticket Priority Dataset contains 50,000 synthetic helpdesk tickets generated across 25 companies of different sizes and industries. Each

📄 Dataset Description: Electrical Appliances Sales vs Temperature This dataset contains 100 records of synthetic sales data for various electrical

📊 Dashboard IdeasSales Performance Overview Total Sales, Total Profit, Total Quantity (cards or KPI tiles) Profit by Product Category/Sub-Category (bar/column

This is part 2 of DAX series on this project: Part 1 and Dataset is here : Employees-payroll-data-questions 🔢 DAX

Here’s a summary of the 7 tables in the organic product sales dataset: The Dataset was found on kaggle :
On Star & Snowflake Schema Creating a Sales vs. Budget Analysis Dashboard in Power BI based on snowflake schema is