
Hello, I am Ankit Srivastava, a Data Analytics Professional passionate about transforming complex data into meaningful insights that help businesses make smarter, data-driven decisions. In today’s data-driven business environment, financial analysis dashboards play a crucial role in helping organizations monitor their financial health and make informed strategic decisions. Instead of relying on static reports or spreadsheets, businesses now use interactive dashboards to track revenue, expenses, profitability, and financial performance in real time. A well-designed financial dashboard simplifies complex financial data and presents it in a clear, visual format that executives and finance teams can easily understand. However, building an effective financial dashboard requires careful planning, proper KPI selection, reliable data sources, and strong visualization strategies to ensure the insights generated truly support business growth.
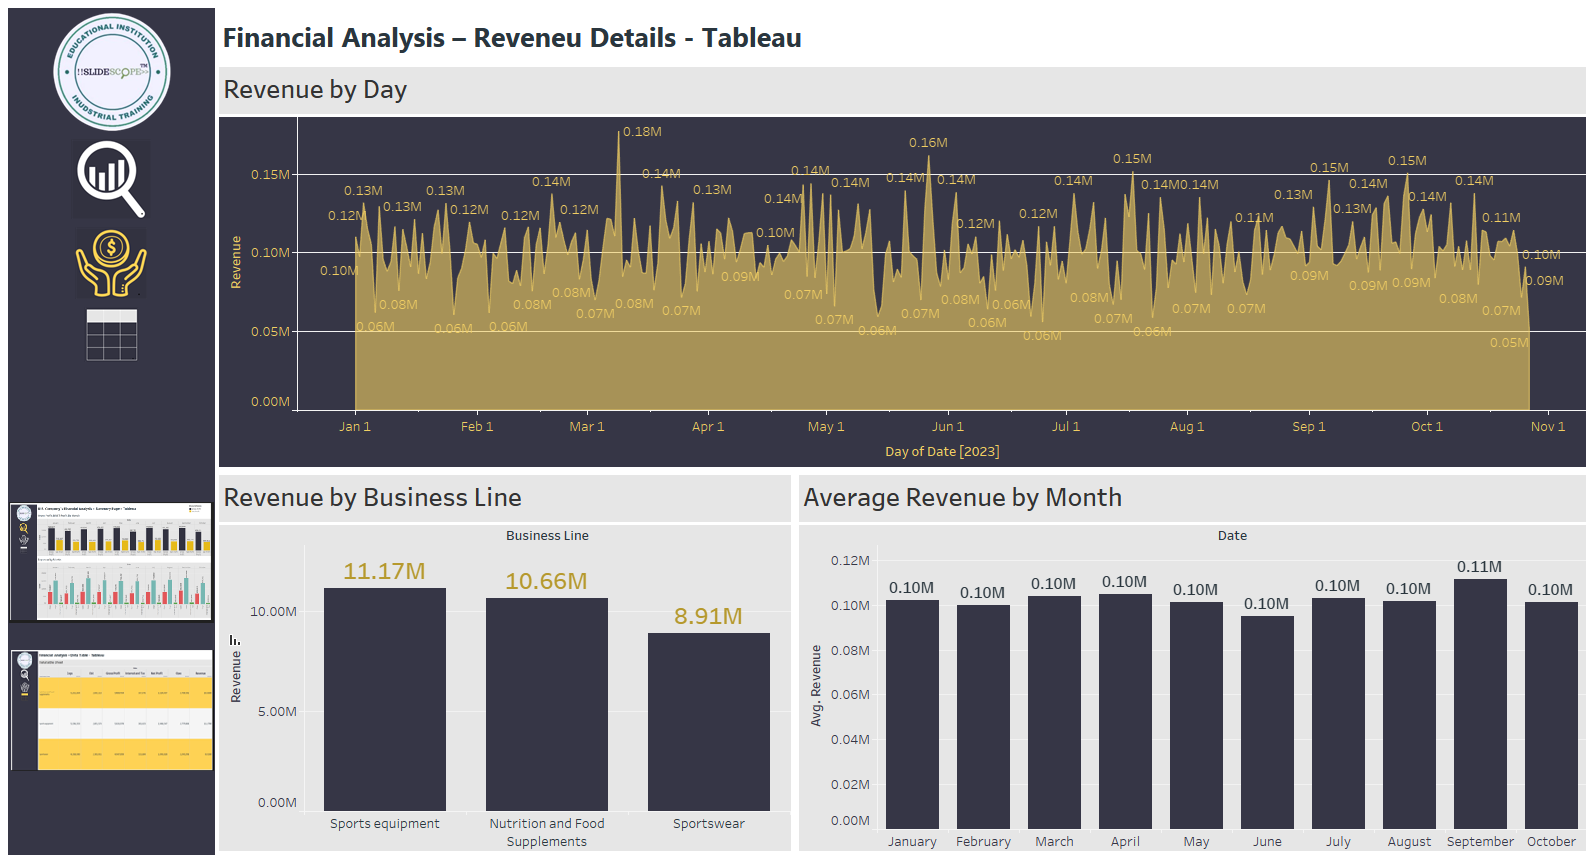
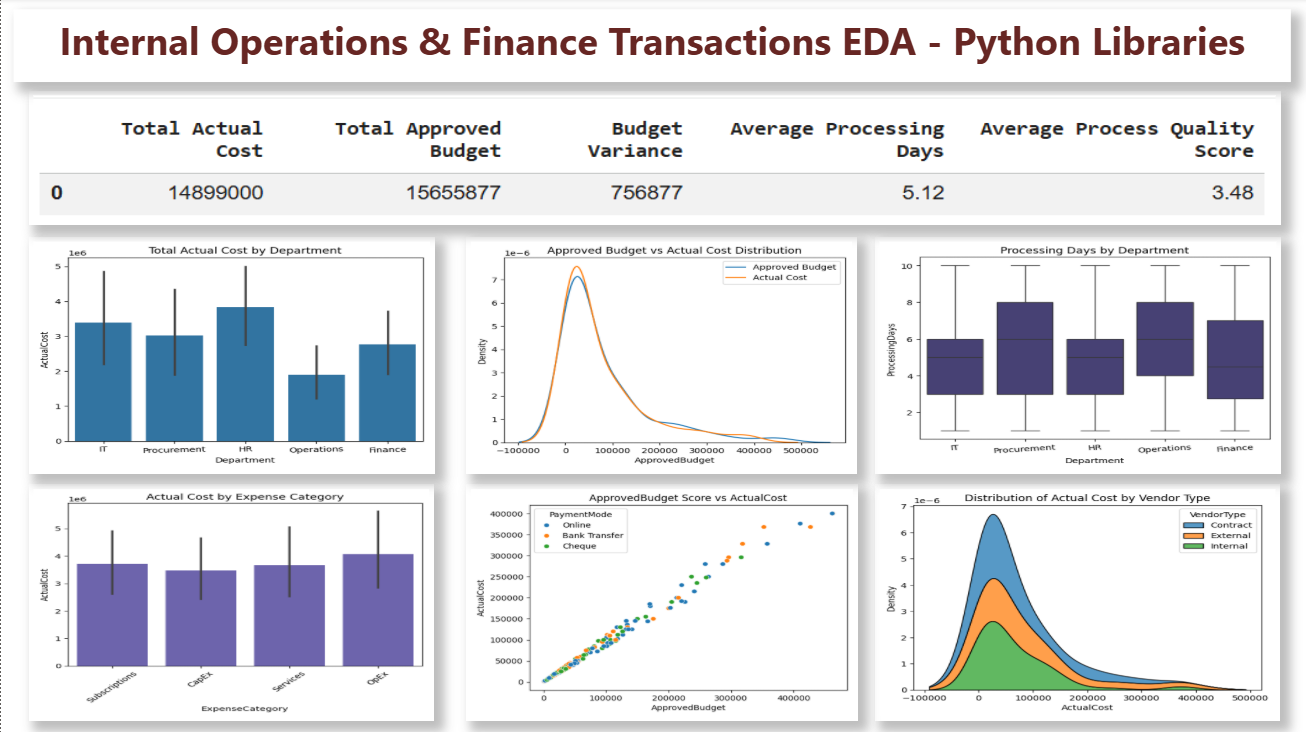
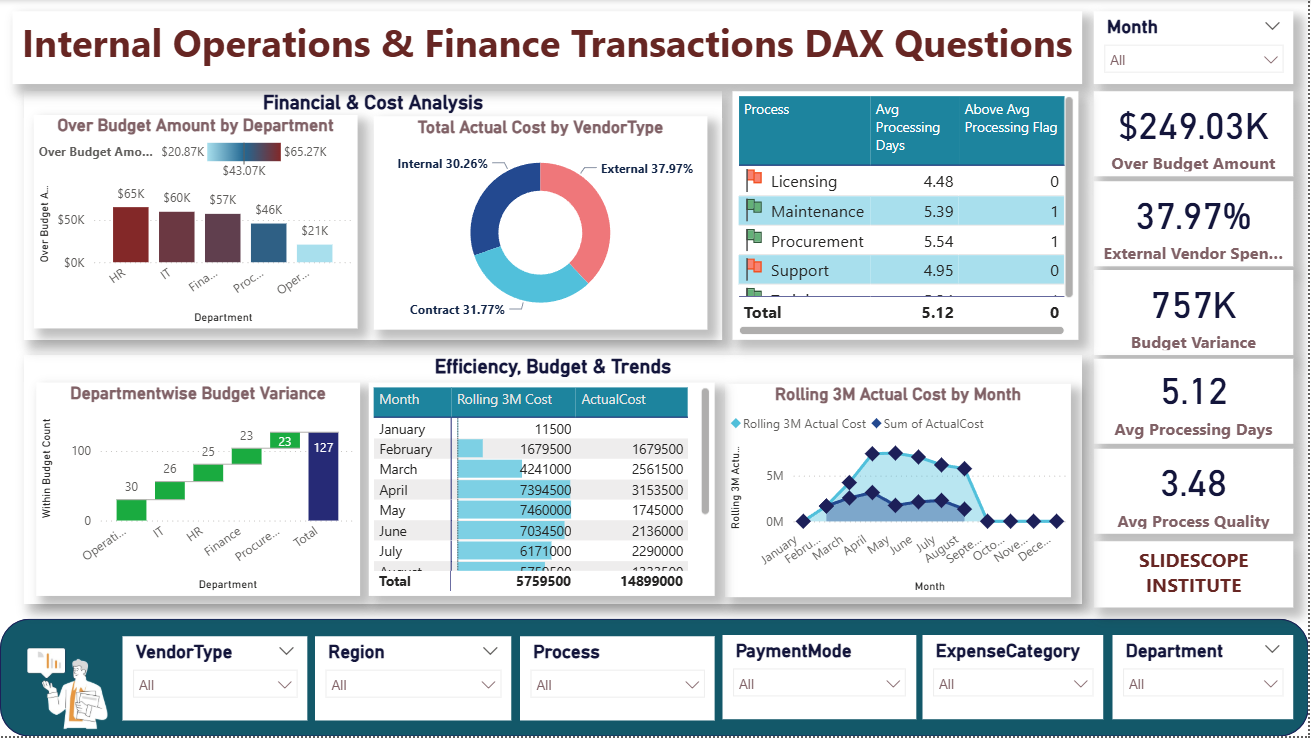
See Some Financial Analysis Dashboard Examples here:


1. Define Clear Business Objectives
Before designing a financial analysis dashboard, it is important to clearly define the business objectives. A dashboard should answer specific financial questions such as profitability, cost efficiency, revenue trends, or budget performance. When objectives are clear, the dashboard becomes a strategic decision-making tool rather than just a data display. Organizations should identify stakeholders like CFOs, finance managers, or executives and understand what financial insights they require. Aligning the dashboard with business goals ensures that it delivers meaningful insights. Without clear objectives, dashboards often become cluttered with unnecessary data that adds complexity instead of value.
2. Identify the Right Financial KPIs
Selecting the correct Key Performance Indicators (KPIs) is essential for an effective financial dashboard. Important KPIs may include revenue growth, operating profit margin, net profit, cash flow, return on investment (ROI), and expense ratios. These metrics provide a quick overview of financial health and performance. Instead of showing too many numbers, dashboards should focus on the most impactful KPIs that drive business decisions. Finance teams should prioritize metrics that align with company strategy and operational goals. Proper KPI selection helps decision-makers quickly understand financial trends and identify potential risks or opportunities in business performance.
3. Ensure Data Accuracy and Reliability
Financial decisions rely heavily on data accuracy, so ensuring reliable data sources is crucial. The dashboard should pull information from trusted financial systems such as ERP software, accounting tools, or financial databases. Data validation processes should be implemented to eliminate inconsistencies or errors. If inaccurate data enters the dashboard, it can lead to incorrect financial decisions and serious business consequences. Automated data integration and regular auditing can help maintain data integrity. A financial dashboard should be built on a strong data foundation so stakeholders can confidently rely on the insights generated from it.
4. Use Simple and Clear Visualizations
Financial dashboards should present complex financial data in a simple and understandable format. Visualizations like bar charts, line graphs, KPI cards, and pie charts help users quickly interpret financial information. Overly complicated charts can confuse users and reduce the dashboard’s effectiveness. Clear labeling, consistent colors, and well-organized layouts improve readability. Visual hierarchy should highlight the most important financial metrics first. When financial insights are visually easy to understand, executives can quickly analyze trends, compare performance, and make strategic decisions without spending too much time interpreting raw financial data.
5. Implement Real-Time Data Updates
Modern businesses require real-time or near real-time financial insights. A financial analysis dashboard should be designed to update automatically as new data becomes available. Real-time data allows finance teams to monitor revenue, expenses, and profitability continuously. This helps organizations respond quickly to financial changes or emerging risks. Automated data pipelines and integrations with financial systems ensure that the dashboard always reflects the latest financial information. Real-time dashboards support proactive decision-making instead of relying on outdated reports generated days or weeks earlier.
6. Enable Drill-Down Analysis
A good financial dashboard should allow users to explore data in detail through drill-down features. While the main dashboard provides a high-level financial overview, users should be able to click on charts or metrics to view deeper insights. For example, revenue can be analyzed by region, product category, or time period. Drill-down capabilities help finance teams identify the root cause of financial trends, such as rising expenses or declining sales. This functionality transforms a dashboard from a static report into an interactive analytical tool that supports deeper financial analysis.
7. Maintain a Clean and Organized Layout
Dashboard layout plays a major role in usability. A cluttered financial dashboard filled with too many charts and numbers can overwhelm users. Instead, dashboards should follow a structured layout where key financial KPIs are displayed at the top and detailed insights appear below. Grouping related financial metrics together improves readability and logical flow. Consistent spacing, alignment, and formatting create a professional look. An organized dashboard helps users quickly locate the information they need and improves the overall efficiency of financial analysis.
8. Include Comparative Analysis
Financial dashboards become more powerful when they include comparative analysis features. Comparing current financial performance with previous periods, budgets, or forecasts provides deeper insights. For example, users should be able to compare current revenue with last month, last quarter, or last year. Variance analysis between actual and budgeted values also helps identify financial gaps. These comparisons highlight trends, improvements, or potential financial problems. Comparative insights allow management to evaluate performance more effectively and adjust strategies accordingly.
9. Focus on User Experience and Accessibility
The dashboard should be designed with the end user in mind. Finance professionals, executives, and analysts may all use the dashboard, so it must be intuitive and easy to navigate. Filters, dropdowns, and interactive controls help users customize their view. The dashboard should also work smoothly across different devices, including laptops, tablets, and large presentation screens. A user-friendly dashboard encourages frequent usage and improves data-driven decision-making across the organization. When users can quickly access financial insights, they can make more informed strategic decisions.
10. Ensure Security and Data Governance
Financial data is highly sensitive, so security and governance are critical considerations when creating a financial analysis dashboard. Access control should be implemented to ensure that only authorized users can view or edit financial data. Role-based permissions help protect confidential information such as salaries, profits, and strategic financial metrics. Data encryption and secure data connections should also be implemented. Additionally, organizations should maintain proper governance policies to track data sources, updates, and usage. Strong security measures build trust in the dashboard and protect the organization’s financial information from unauthorized access.
Conclusion
Creating a financial analysis dashboard is not just about displaying numbers or financial charts; it is about transforming raw financial data into meaningful insights that support strategic decision-making. A well-designed dashboard acts as a powerful analytical tool that enables organizations to monitor financial performance, identify trends, detect risks, and evaluate business growth. By focusing on clear business objectives, selecting the right KPIs, and ensuring data accuracy, organizations can build dashboards that truly reflect their financial health and operational efficiency.
Another important aspect of an effective financial dashboard is simplicity and usability. Complex financial data can often overwhelm decision-makers, especially when presented through complicated reports or spreadsheets. A dashboard simplifies this process by converting financial information into easy-to-understand visualizations. When executives and finance teams can quickly interpret revenue trends, cost patterns, or profitability metrics, they can make faster and more confident decisions. This is particularly important in today’s fast-paced business environment where timely decisions can directly influence profitability and competitive advantage.
Real-time data integration also plays a critical role in financial analysis dashboards. Businesses today operate in dynamic markets where financial conditions can change rapidly. Having access to real-time financial insights allows organizations to respond quickly to emerging challenges or opportunities. For example, if expenses suddenly increase or revenue declines, finance teams can immediately investigate the cause and take corrective actions. Real-time dashboards reduce reliance on delayed reports and provide continuous financial visibility to stakeholders.
Interactive features such as drill-down analysis and comparative reporting further enhance the value of financial dashboards. Instead of simply showing overall financial results, these features allow users to explore deeper insights, analyze trends across different time periods, and compare actual results with budgets or forecasts. This level of analysis helps organizations identify performance gaps, optimize financial strategies, and improve forecasting accuracy. By understanding the factors that influence financial performance, businesses can implement more effective planning and resource allocation strategies.
Security and governance are equally essential when handling financial data. Since financial dashboards often contain confidential and sensitive information, organizations must implement strict access controls and data protection measures. Role-based access, secure data connections, and strong governance policies ensure that financial information remains protected while still being accessible to authorized stakeholders who need it for decision-making purposes.
Ultimately, a successful financial analysis dashboard bridges the gap between raw financial data and actionable business intelligence. It empowers finance teams, executives, and decision-makers with the insights needed to drive business growth, improve financial planning, and maintain long-term organizational stability. By carefully implementing the key principles discussed above, organizations can design dashboards that not only visualize financial performance but also support smarter, faster, and more strategic business decisions.