
By Ankit Srivastava | Data Analytics & Visualization Expert
Introduction
Transformers are at the heart of every power distribution system. Their performance, reliability, and efficiency determine how effectively electrical energy is transmitted and distributed.
As an engineer and data analyst, I’ve always been fascinated by how data can reveal insights that go unnoticed in traditional engineering reports.
That’s exactly what inspired me to create the Transformer Efficiency Analysis Dashboard – Part 1, built using Power BI.
In this tutorial, I’ll walk you through the entire process — from dataset preparation to dashboard design — explaining how we can use Power BI to analyze the factors affecting transformer efficiency using real engineering data.
Our target variable is Efficiency_%, and we’ll explore how parameters like load current, core material, cooling method, and winding material influence it.
Dataset Overview
Let’s start by understanding our dataset.
We have 9 columns, representing the operational and material characteristics of different transformers.
| Column Name | Description |
|---|---|
| Tf_ID | Unique transformer identifier |
| Input_Voltage_V | Voltage applied at input (Volts) |
| Load_Current_A | Current drawn by the transformer (Amperes) |
| Core_Loss_W | Power loss in transformer core (Watts) |
| Copper_Loss_W | Power loss in transformer windings (Watts) |
| Core_Material | Material used for transformer core (e.g., CRGO Steel, Amorphous Steel) |
| Cooling_Method | Cooling type (ONAN, ONAF, Dry Type) |
| Winding_Material | Material used in windings (Copper or Aluminum) |
| Load_Type | Type of load served (Residential, Commercial, Industrial) |
| Efficiency_% | Efficiency of the transformer (Target Variable) |
Each record represents a transformer unit tested under specific load and cooling conditions.
Get the dataset here: https://colorstech.net/wp-content/uploads/2025/11/transformer_efficiency_dataset.csv
Right Click the link and then Save as CSV file.
⚙️ Step 1: Data Import and Cleaning in Power BI
Open Power BI Desktop and follow these steps:
- Click Get Data → Text/CSV
- Browse your CSV file and load the dataset.
- In the Power Query Editor, check the data types:
- Numeric columns → set to Decimal Number
- Categorical columns → set to Text
- Handle any missing or incorrect data using Replace Values or Remove Rows.
💡 Tip: If efficiency values are computed externally, validate that:
[
Efficiency = \frac{Output Power}{Input Power} \times 100
]If not, you can calculate it inside Power BI for better consistency.
🧮 Step 2: Add Measures for Analysis
To make our dashboard interactive, we need to create measures for key metrics.
Go to the Modeling tab → New Measure and define:
Avg Efficiency = AVERAGE(Data[Efficiency_%])
Avg Load Current = AVERAGE(Data[Load_Current_A])
Avg Input Voltage = AVERAGE(Data[Input_Voltage_V])
Avg Core Loss = AVERAGE(Data[Core_Loss_W])
Avg Copper Loss = AVERAGE(Data[Copper_Loss_W])
We can also compute the Total Transformers Tested:
Total Transformers = DISTINCTCOUNT(Data[Tf_ID])
These measures will later power our KPI cards and visual comparisons.
📊 Step 3: Create KPIs for Quick Summary
Let’s add KPI visuals to highlight the main statistics.
KPIs added:
- Average Load Current (A)
- Average Copper Loss (W)
- Average Core Loss (W)
- Average Input Voltage (V)
- Average Efficiency (%)
💡 Tip: Use a consistent color palette for KPIs — here I used blue and brown tones for a professional engineering theme.
Each KPI card was created using:
- Card visual
- Selected measure (e.g., Avg Efficiency)
- Adjusted font to bold and set data label size for clarity.
🧩 Step 4: Analyzing Transformer Efficiency
Since Efficiency_% is our target, our goal is to explore what affects it most.
We’ll do this using multiple visuals that break down efficiency by material, cooling type, and load type.
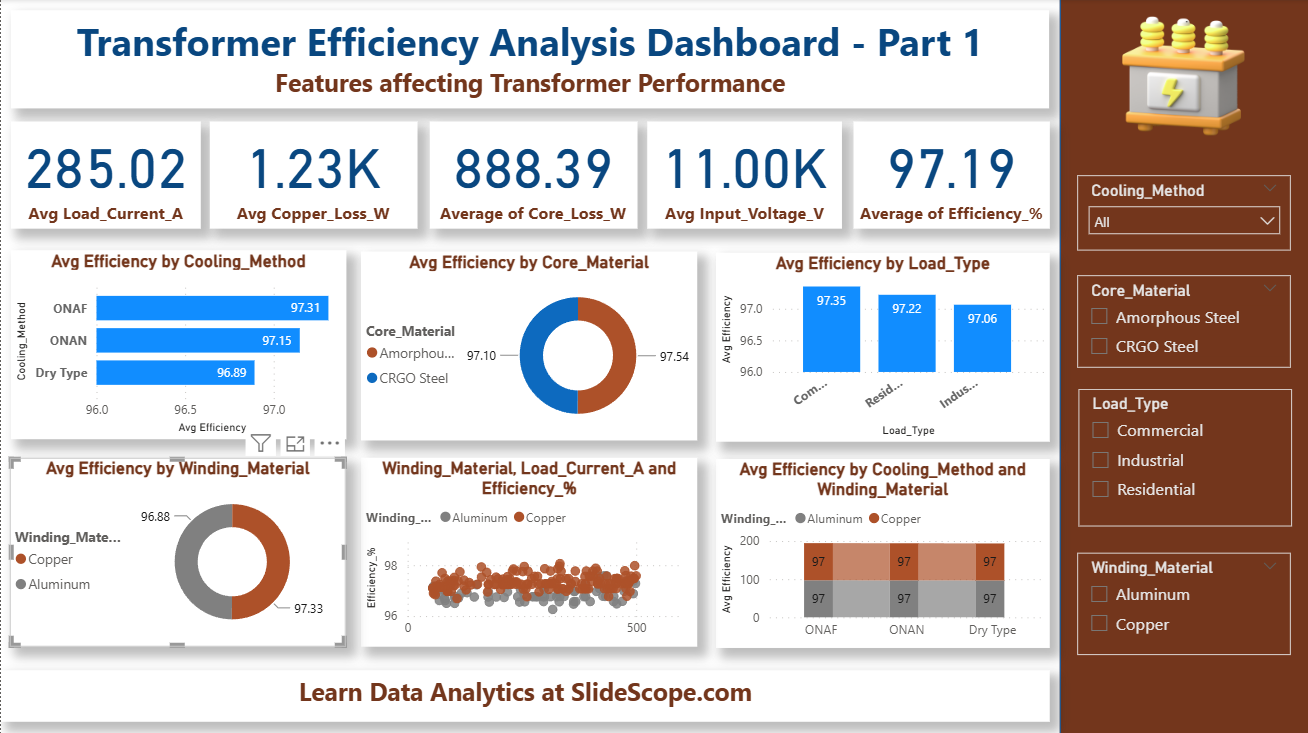
🔸 A. Avg Efficiency by Cooling Method
Create a Clustered Bar Chart:
- Axis: Cooling_Method
- Value: Avg Efficiency
This reveals which cooling method delivers better performance.
Insight:
- ONAF (Oil Natural Air Forced) has the highest efficiency (≈ 97.31%)
- ONAN (Oil Natural Air Natural) follows closely (≈ 97.15%)
- Dry Type shows slightly lower efficiency (≈ 96.89%)
💡 Engineering Takeaway:
Better cooling enhances efficiency by reducing copper and core losses.
🔸 B. Avg Efficiency by Core Material
Add a Donut Chart:
- Legend: Core_Material
- Values: Avg Efficiency
Observation:
- Amorphous Steel cores achieve slightly better efficiency (97.54%)
- CRGO Steel is efficient but marginally lower (97.10%)
💡 Engineering Insight:
Amorphous steel reduces hysteresis loss, leading to improved efficiency — a key finding in modern transformer design.
🔸 C. Avg Efficiency by Load Type
Use a Column Chart:
- Axis: Load_Type
- Values: Avg Efficiency
Results:
- Commercial transformers: 97.35%
- Residential: 97.22%
- Industrial: 97.06%
This suggests lightly loaded commercial transformers maintain higher efficiency compared to heavily loaded industrial ones.
🔸 D. Avg Efficiency by Winding Material
Create another Donut Chart:
- Legend: Winding_Material
- Values: Avg Efficiency
Findings:
- Copper winding: 97.33%
- Aluminum winding: 96.88%
💡 Conclusion:
Copper’s lower resistance contributes to reduced I²R (copper) losses, directly improving efficiency.
🧮 Step 5: Relationship Visuals – Scatter and Combination Charts
To visualize continuous relationships:
📈 A. Load Current vs Efficiency by Winding Material
Use a Scatter Chart:
- X-axis: Load_Current_A
- Y-axis: Efficiency_%
- Legend: Winding_Material
This helps analyze how efficiency changes with load current for copper vs aluminum windings.
Insight:
- Efficiency tends to decline slightly with higher load currents.
- Copper windings consistently outperform aluminum, especially under higher current loads.
📊 B. Efficiency by Cooling Method and Winding Material
Create a Stacked Column Chart:
- Axis: Cooling_Method
- Legend: Winding_Material
- Values: Avg Efficiency
This multi-dimensional view shows how cooling method and winding material interact.
Finding:
Copper windings under ONAF cooling deliver the best efficiency range (~97.4%), making it the optimal design combination.
🗺️ Step 6: Mapping Transformer Locations (Optional)
If your dataset includes geographic data (like city or plant name), you can add a Map Visual.
- Location: City
- Value: Avg Efficiency
- Size: Load_Current_A
This helps visualize where transformers are performing efficiently or facing higher losses.
🎨 Step 7: Designing the Dashboard Layout
To ensure clarity and professionalism, I divided the dashboard into three main sections:
- Header Section
- Dashboard Title: “Transformer Efficiency Analysis Dashboard – Part 1”
- Subtitle: “Features Affecting Transformer Performance”
- Add a small transformer icon for visual appeal.
- KPI Section (Top Row)
- 5 KPI Cards summarizing major metrics.
- Visual Analysis Section (Middle and Bottom Rows)
- Cooling Method, Core Material, Load Type, Winding Material, and Combination charts.
- Filter Pane (Right Side)
- Slicers for:
- Cooling_Method
- Core_Material
- Load_Type
- Winding_Material
- Slicers for:
These slicers allow engineers or analysts to dynamically explore transformer subsets.
💡 Design Tip:
Use a brown & cream engineering palette for technical dashboards to reduce visual strain and maintain readability.
🧠 Step 8: Insights and Interpretations
Let’s summarize what our Power BI dashboard reveals:
| Factor | Observation | Interpretation |
|---|---|---|
| Cooling Method | ONAF yields highest efficiency | Forced air cooling improves heat dissipation and reduces losses |
| Core Material | Amorphous steel > CRGO steel | Reduced core losses lead to better efficiency |
| Winding Material | Copper > Aluminum | Lower resistivity means lower copper losses |
| Load Type | Commercial > Residential > Industrial | Efficiency decreases with higher operational loads |
| Load Current | Higher current = Slight efficiency drop | Confirms the non-linear load loss relationship |
💡 These insights can guide transformer design engineers toward optimal configurations for maximum energy efficiency.
⚡ Step 9: Enhancing Interactivity
Power BI allows us to add tooltips, cross-filtering, and dynamic visuals.
- Enable Cross-Highlighting:
- Selecting “ONAF” filters all visuals automatically.
- Add Tooltips:
- Hovering over any data point shows precise metrics (Voltage, Current, Efficiency, etc.).
- Drill Through:
- Users can right-click a specific cooling method and explore related efficiency distributions.
🧩 Step 10: Publishing and Sharing the Dashboard
Once satisfied with the analysis:
- Click Publish to share your dashboard to Power BI Service.
- Create a Workspace named “Transformer Analytics”.
- Configure access for your engineering or analytics team.
You can also embed this dashboard into an internal SharePoint page or display it in an engineering monitoring portal.
📈 Why Power BI for Engineering Analytics?
As someone who has worked with both electrical data and business intelligence, I’ve seen how tools like Power BI can bridge the gap between engineers and decision-makers.
Here’s why Power BI is ideal:
- It handles real-time sensor and test data.
- You can combine operational parameters and financial KPIs in one view.
- Engineers get visual clarity, while management gets strategic insights.
🔧 Future Enhancements (Part 2 Preview)
In Part 2 of this project, I’ll take this analysis further by:
- Implementing regression models in Power BI using DAX to predict efficiency.
- Integrating temperature and humidity data for environmental correlation.
- Adding Power BI bookmarks and drill-downs for interactive storytelling.
Stay tuned for that video and article soon.
💬 Final Thoughts
The Transformer Efficiency Analysis Dashboard shows how engineering data can be transformed into valuable insights using modern analytics tools.
Instead of static Excel sheets or handwritten test logs, engineers can now visualize performance trends dynamically — understanding exactly which materials, cooling methods, and operating conditions deliver the best transformer efficiency.
This is the power of Data Analytics in Electrical Engineering — blending data science with real-world problem-solving.
🧠 Key Takeaways:
- Target Variable: Efficiency_%
- Best Performer: Copper + ONAF + Amorphous Steel
- Tool Used: Power BI
- Core Learning: Data-driven decision-making improves transformer design.
✍️ Written by: Ankit Srivastava
Power BI Trainer | Data Analyst | Electrical Engineer
Helping engineers transform complex datasets into actionable insights.
👉 Learn more tutorials like this at SlideScope.com
and follow me for Power BI and Data Analytics learning resources.