
By Ankit Srivastava | Data Analytics & Power BI Instructor | SlideScope.com Institute
Welcome back to Part 2 of our Hotel Guest Stays Data Analysis series. In Part 1, we explored stay duration, occupancy patterns, and guest behavior trends. Today, in Part 2, we shift our focus to a key performance metric for the hospitality industry — Total Spend per Guest and its deeper segmentation across booking channels, room types, guest demographics, satisfaction ratings, and countries.
Get the Dataset Here
This tutorial is hands-on and ideal for those learning Business Intelligence, Hospitality Analytics, Hotel Revenue Management, and Power BI Dashboard design. By the end of this guide, you’ll be able to calculate Total Spend, model it in Power BI, and build interactive visuals to derive actionable revenue insights for hotel businesses.
✅ Objective of This Dashboard
Hotels don’t just make money from room bookings — a major share often comes from F&B, spa, bar, events, tours, and other services. This report helps us understand:
| Key Insight Area | Business Value |
|---|---|
| Revenue split by channels | Optimize marketing and OTA commissions |
| Spend across room types | Pricing strategy for luxury vs budget rooms |
| Spend by age groups | Offers for high-value customer segments |
| Spend vs feedback score | Link service quality to revenue |
| Spend by nights stayed | Identify guest stay patterns |
| Spend by country | Geo-targeted hospitality promotions |
This dashboard mimics real hospitality industry reporting used in hotel chains, boutique resorts, and tourism businesses.
🧾 Dataset Description
We are working with the following dataset columns:
| Column | Meaning |
|---|---|
| Guest_ID | Unique guest stay record |
| Nights_Stayed | Duration of stay |
| Room_Fare | Booking fare (USD) |
| Additional_Spend | Food, spa, bar, events, services |
| Guest_Age | Customer demographics |
| Room_Type | Single, Double, Suite, Deluxe |
| Booking_Channel | Direct, OTA, Walk-in, Corporate |
| Country | Guest origin |
| Feedback_Rating | Guest satisfaction (Excellent to Poor) |
🧮 Important Measure Used
We engineered a new metric:
Total Spend = hotel_guest_stays[Room_Fare] + hotel_guest_stays[Additional_Spend]
Then created the main DAX measure:
Spend = SUM(hotel_guest_stays[Total Spend])
This tells us how much a guest spends in total during their stay — a core hotel performance KPI.
🚀 Step-By-Step Tutorial to Build the Dashboard
Step 1: Import Dataset
Open Power BI Desktop
Home → Get Data → Excel/CSV → Select Hotel Guest Stays Data File
Click Load.
Step 2: Create Total Spend Calculated Column
Go to Modeling → New Column and enter:
Total Spend = hotel_guest_stays[Room_Fare] + hotel_guest_stays[Additional_Spend]
This prepares the dataset for spend-based visuals.
Step 3: Create DAX Measure for Spend
Now add our Spend measure:
Spend = SUM(hotel_guest_stays[Total Spend])
This allows aggregation across filters.
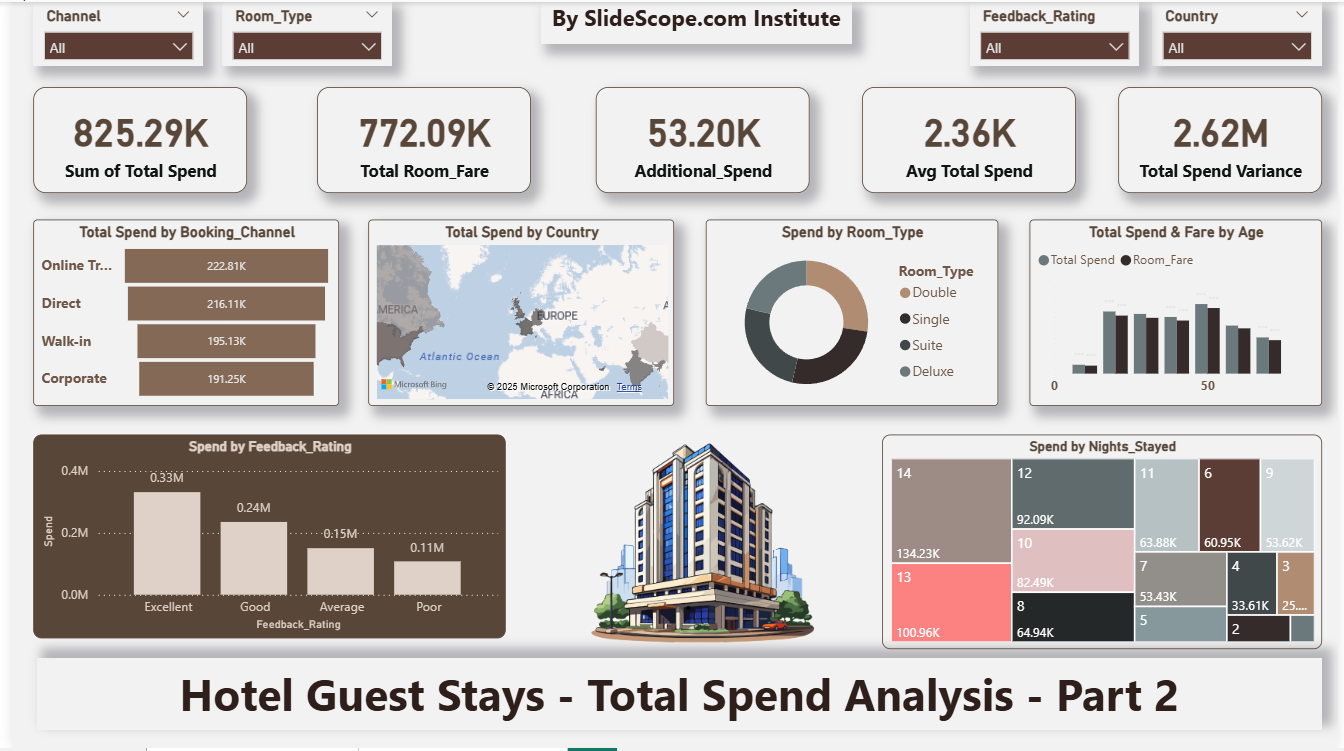
Step 4: Create KPI Cards
We used KPI Cards to show:
| Metric | Definition |
|---|---|
| Sum of Total Spend | Revenue from all guests |
| Total Room Fare | Only booking revenue |
| Additional Spend | Non-room revenue |
| Avg Total Spend | Average guest spend |
| Total Spend Variance | Variation trends |
These provide revenue snapshot for hotel managers.
Visual → Card → Drag Fields
Step 5: Build Comparison Visuals
Spend by Booking Channel
(Direct vs OTA vs Walk-In vs Corporate)
Insight: OTAs bring volume but direct bookings ensure higher margins. Corporate stays provide steady income.
Use Bar Chart
Axis → Booking_Channel
Values → Spend
Spend by Country
(Hotel geography market mix)
Use Filled Map
Location → Country
Values → Spend
Insight: Helps allocate marketing budgets to top-spending countries.
Spend by Room Type
(Budget vs Luxury customers)
Use Donut Chart
Legend → Room_Type
Values → Spend
Typical trend: Suite & Deluxe guests spend more on extra services.
Total Spend & Fare by Age
(age-wise segmentation)
Use Clustered Column Chart
Axis → Age
Values → Spend & Room_Fare
Insight: Middle age groups (30-55) tend to spend more — business + leisure travelers.
Spend by Feedback Rating
(Good service boosts revenue)
Use Column Chart
Axis → Feedback_Rating
Values → Spend
Real-world insight:
Hotels should focus on service excellence — happy customers spend more and return more.
Spend vs Nights Stayed
(Do long-stay guests spend more?)
Use Treemap
Group → Nights_Stayed
Values → Spend
Insight: Longer stays = higher total spend, but average spend per day could vary.
Step 6: Add Slicers
Add slicers for:
- Room Type
- Booking Channel
- Country
- Feedback Rating
This makes dashboard interactive for decision makers.
Step 7: Formatting & UI Design
Power BI formatting used:
- Brown & gold hotel luxury theme
- Card shadows & rounded corners
- Center banner: By SlideScope.com Institute
- Hotel icon for branding
- Consistent fonts & clean white background
Design tip:
Hospitality dashboards should feel premium — not corporate.
📊 Key Business Insights from Dashboard
| Insight | Meaning |
|---|---|
| High spend from direct & corporate bookings | Strengthen direct booking campaigns |
| Suite & Deluxe generate highest spend | Premium upgrade promotions valuable |
| Guests 30-55 spend the most | Target professional travelers |
| Excellent feedback = highest revenue | Customer service directly drives profit |
| More nights = more spend | Promote long-stay packages |
Takeaway:
Hotels shouldn’t only focus on occupancy.
👉 Maximizing total guest revenue is the real goal — dining, events, spa, experiences.
🎓 What You Learned in This Tutorial
By completing this project, you practiced:
✔ Data import & cleaning
✔ Calculated columns & DAX measures
✔ KPI cards, maps, donut & bar charts, treemap
✔ Filter-driven storytelling
✔ Hospitality analytics reporting
✔ Dashboard design thinking
This dashboard brings you closer to working as:
- Hospitality BI Analyst
- Hotel Revenue Manager Assistant
- Power BI Analyst
- Data Analyst in Travel/Tourism
- Customer Analytics Specialist
📁 Project Deliverables
| File | Purpose |
|---|---|
| Power BI .PBIX | Dashboard build |
| Dataset Excel / CSV | Source data |
| DAX Script | Total Spend calculation |
| PDF Export | Portfolio presentation |
If you’re building a data analyst portfolio, showcase:
- Screenshot
- Explanation
- Business insights
- Link to PBIX file
🎥 Next Lesson (Part 3 Preview)
In the upcoming part, we will cover:
- Guest segmentation using DAX clustering
- RFM analysis for hotels (Recency-Frequency-Monetary)
- Predictive churn indicators
- Pricing recommendation visuals
💬 Final Thoughts from Ankit
Hotels don’t just sell rooms —
they sell complete guest experiences.
By quantifying how different guests behave and spend, businesses can:
- Personalize offers
- Reduce OTA dependency
- Improve guest satisfaction
- Drive repeat stays
- Boost lifetime value of customers
Mastering dashboards like this builds your real-world data analytics muscle. Keep practicing and share your dashboards online — your portfolio matters.