
Project Overview
The USA Car Sales Project is a comprehensive data visualization initiative focused on uncovering actionable insights in the automotive sector using Power BI. By integrating data from diverse sources—ranging from Excel and CSV files to SQL Server and XML—we built an interactive and analytical dashboard that allows business users to monitor performance metrics such as sales, pricing trends, and regional performance across different car body styles.
📊 Data Sources Used
To ensure a rich and dynamic dataset, multiple formats were ingested into Power BI:
- CSV Files
- Excel Files
- SQL Server Database – Extracted to Excel
- Access Database
- XML Files
🧠 Project Breakdown – 5-Part Series
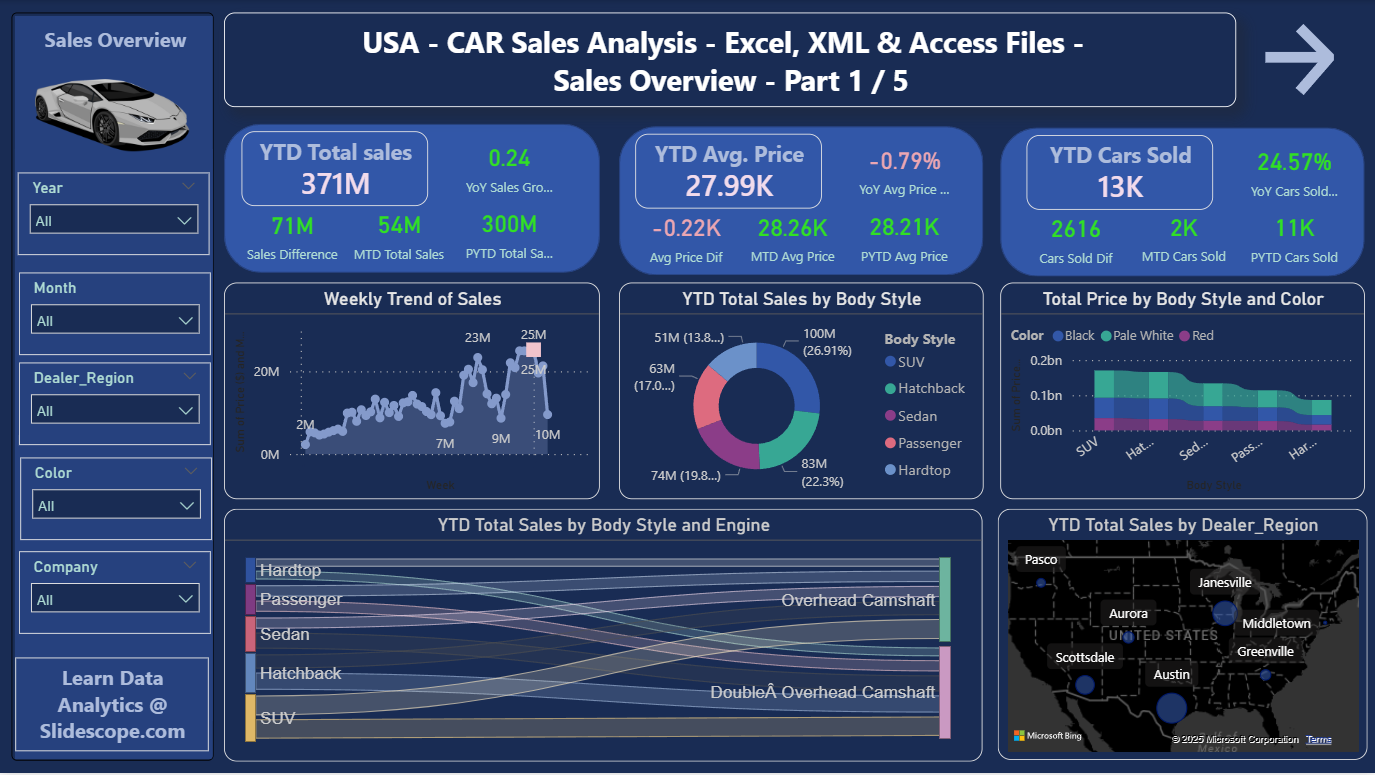
🔍 Part 1: Initial Exploration & KPIs
After successfully connecting all data sources, Part 1 of the project focused on key performance metrics and visuals. Below are the primary business questions we answered:
✅ Business Questions Answered
- YTD (Year-To-Date) Total Sales
- MTD (Month-To-Date) Total Sales
- YoY (Year-Over-Year) Sales Growth
- YTD Average Price
- MTD Average Price
- YoY Average Price Growth
- YTD Cars Sold
- MTD Cars Sold
- YoY Cars Sold Growth
📈 Visual Questions Answered
- YTD Sales Monthly Trend
- YTD Sales by Body Style
- Total Price by Body Style and Color
- YTD Cars Sold by Dealer Region
- YTD Total Sales by Body Style and Engine
These visualizations helped identify which car types, colors, and regions were performing best, aiding strategic sales and inventory decisions.
⚙️ DAX Measures Used
To compute these KPIs, we used a calculated Calendar Table and the following DAX measures:
-- Calendar Table
calendar Table = CALENDAR(MIN(Sheet1[Date]), MAX(Sheet1[Date]))
Month = FORMAT('calendar Table'[Date], "MMMM")
Week = WEEKNUM('calendar Table'[Date])
Year = YEAR('calendar Table'[Date])

-- YTD and MTD Sales
YTD Total Sales = TOTALYTD(SUM(Sheet1[Price ($)]), 'calendar Table'[Date])
MTD Total Sales = TOTALMTD(SUM(Sheet1[Price ($)]), 'calendar Table'[Date])
PYTD Total Sales = CALCULATE(SUM(Sheet1[Price ($)]), SAMEPERIODLASTYEAR('calendar Table'[Date]))
Sales Differences = [YTD Total Sales] - [PYTD Total Sales]
YoY Sales Growth = [Sales Differences] / [PYTD Total Sales]

-- Cars Sold Metrics
PYTD Cars Sold = CALCULATE(COUNT(car[Car_id]), SAMEPERIODLASTYEAR('calendar Table'[Date]))
MTD Cars Sold = TOTALMTD(COUNT(car[Car_id]), 'calendar Table'[Date])
These calculations form the backbone of the dashboard and provide real-time performance insights.
📁 Dataset Access
You can explore and download the full dataset from GitHub:
🔗 USA Car Sales Dataset on GitHub
🚀 What’s Next?
In upcoming parts of this project series, we’ll dive into:
- Dealer performance analysis
- Inventory efficiency
- Predictive trends using machine learning
- Customized filtering options for sales managers and executives
Stay tuned as we continue transforming raw automotive data into powerful business intelligence!
If you’re a data enthusiast, analyst, or working in the automotive sector, this Power BI project is a great blueprint to replicate and expand upon.
Part 2 Questions – Company and Car Model-wise Sales Analysis
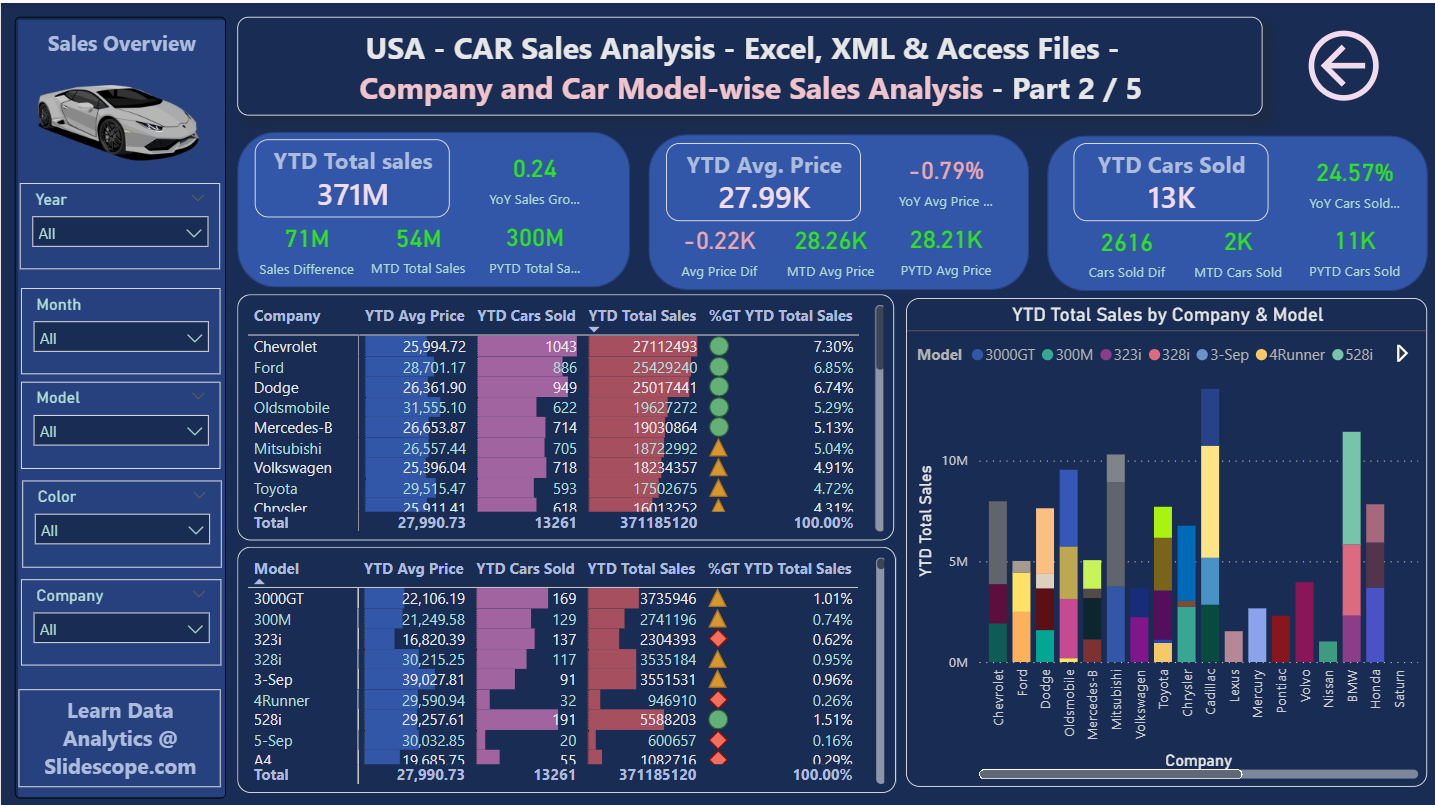
YTD Total Sales , YTD Avg Price, YTD Cars Sold %Grand Total YTD Sales per company
YTD Total Sales , YTD Avg Price, YTD Cars Sold %Grand Total YTD Sales per model
YTD Sales by Company and Model