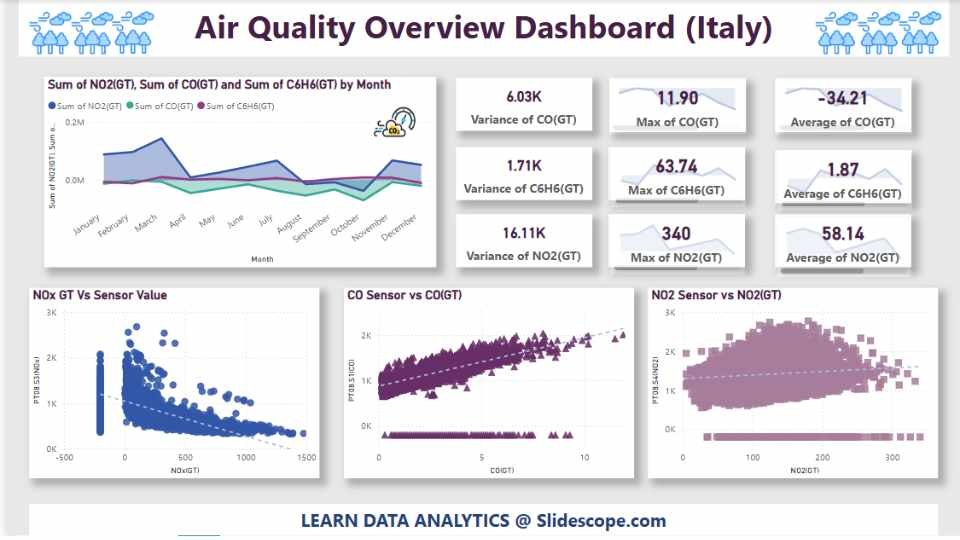
Description
This dataset contains detailed air quality measurements collected over several months, focusing on key air pollutants. It is designed for predictive modeling and data analysis in environmental science and public health. By offering insights into the concentration levels of various gases, the dataset is suitable for both regression and classification tasks in machine learning.

Features
| Feature | Description |
|---|---|
| Date | The date of the measurement. |
| Time | The time of the measurement. |
| CO(GT) | Concentration of carbon monoxide (CO) in the air (µg/m³). |
| PT08.S1(CO) | Sensor reading for CO concentration. |
| NMHC(GT) | Concentration of non-methane hydrocarbons (NMHC) (µg/m³). |
| C6H6(GT) | Concentration of benzene (C6H6) in the air (µg/m³). |
| PT08.S2(NMHC) | Sensor reading for NMHC concentration. |
| NOx(GT) | Concentration of nitrogen oxides (NOx) in the air (µg/m³). |
| PT08.S3(NOx) | Sensor reading for NOx concentration. |
| NO2(GT) | Concentration of nitrogen dioxide (NO2) in the air (µg/m³). |
Statistical Overview
- CO(GT): Values exhibit a wide range, with some measurements as low as -200 µg/m³.
- NOx(GT): Concentration levels vary significantly, with some exceeding 2000 µg/m³.
Cleaned Data is here : https://colorstech.net/wp-content/uploads/2025/01/AirQualityUCI.xlsx
Dataset is available on : https://archive.ics.uci.edu/dataset/360/air+quality
It is Also Available on Kaggle : https://www.kaggle.com/datasets/dakshbhalala/uci-air-quality-dataset
