
PL-300 Practice Question Explained – Running Totals with Waterfall Charts in Power BI
If you’re preparing for the PL-300: Microsoft Power BI Data Analyst certification, understanding which visualization to use for different analytical […]
If you’re preparing for the PL-300: Microsoft Power BI Data Analyst certification, understanding which visualization to use for different analytical […]
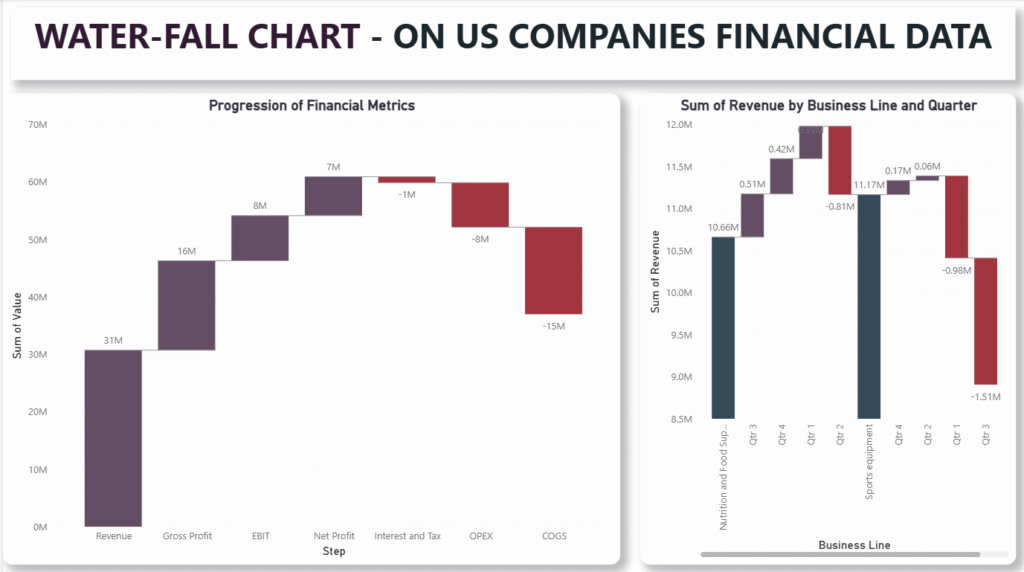
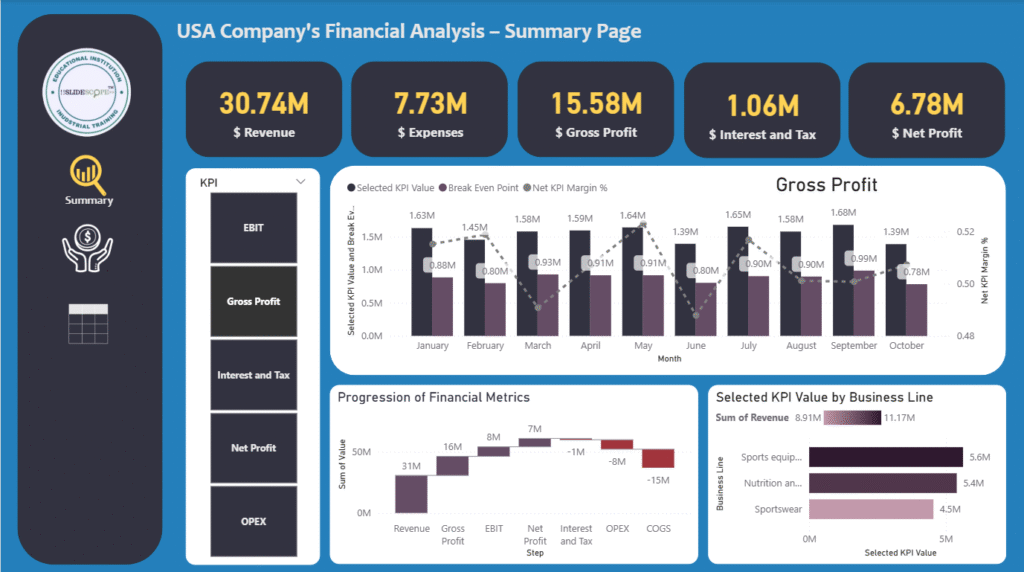
When analyzing business data, one common requirement is to show how values accumulate over time or across different categories. For