
Integrated Business Operations & Sales Performance Dataset for Data Science Projects
Dataset Description The Integrated Business Operations & Sales Performance Dataset is a synthetic yet highly realistic dataset designed for hands-on […]
Dataset Description The Integrated Business Operations & Sales Performance Dataset is a synthetic yet highly realistic dataset designed for hands-on […]
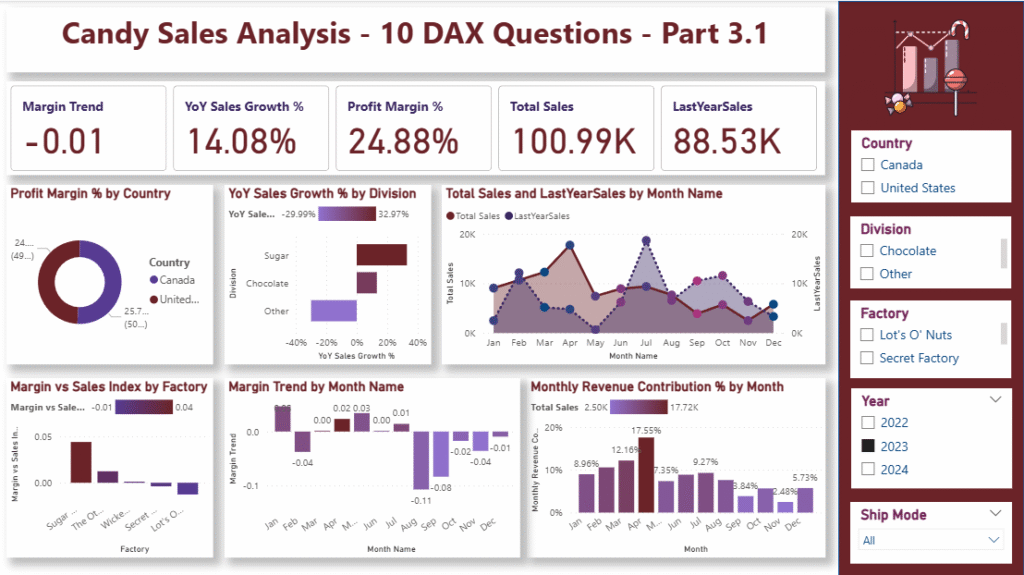
Candy Sales Dataset – Date Table (MANDATORY STEP) 🔹 Step 1: Create a Date Table (DAX) This table generates a
Project & Dataset Explanation Project Introduction In this project, I will teach you how to perform Exploratory Data Analysis (EDA)
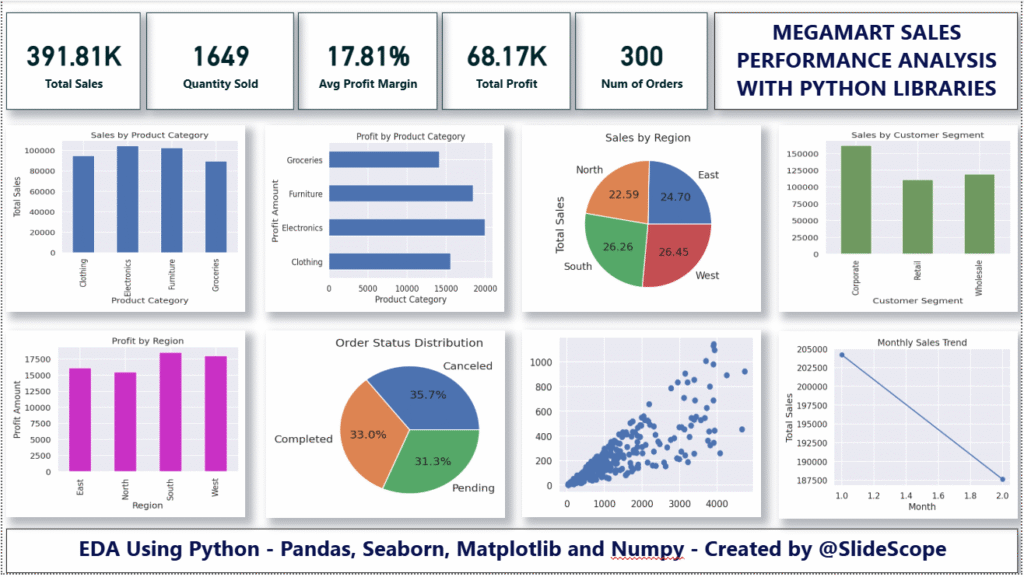
This dataset contains detailed order-level sales information for a retail business operating across different customer segments and product categories. It
Bank Customer Dataset EDA with Python LibrariesIntroduction Exploratory Data Analysis (EDA) is a critical first step in understanding any dataset,
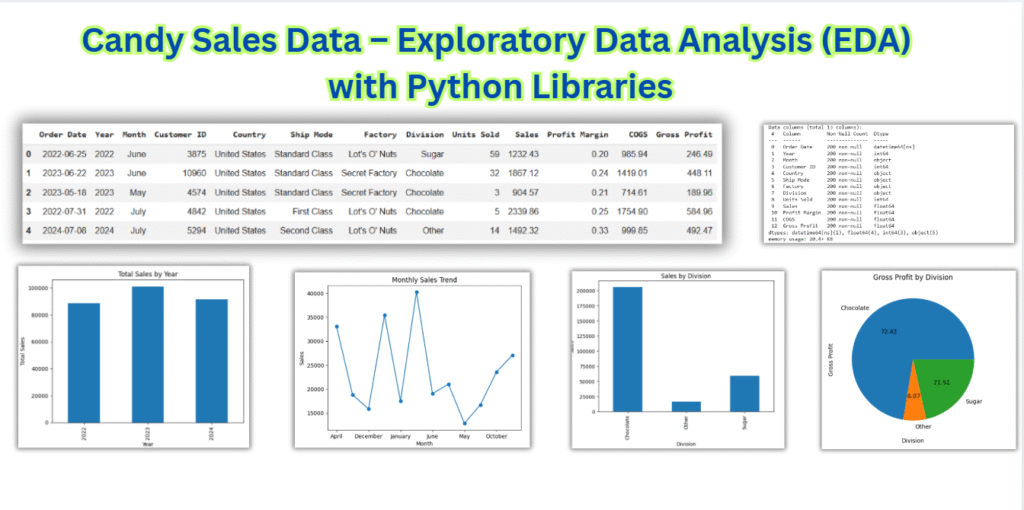
Project & Dataset Introduction In this project, I will teach you how to perform Exploratory Data Analysis (EDA) using Python
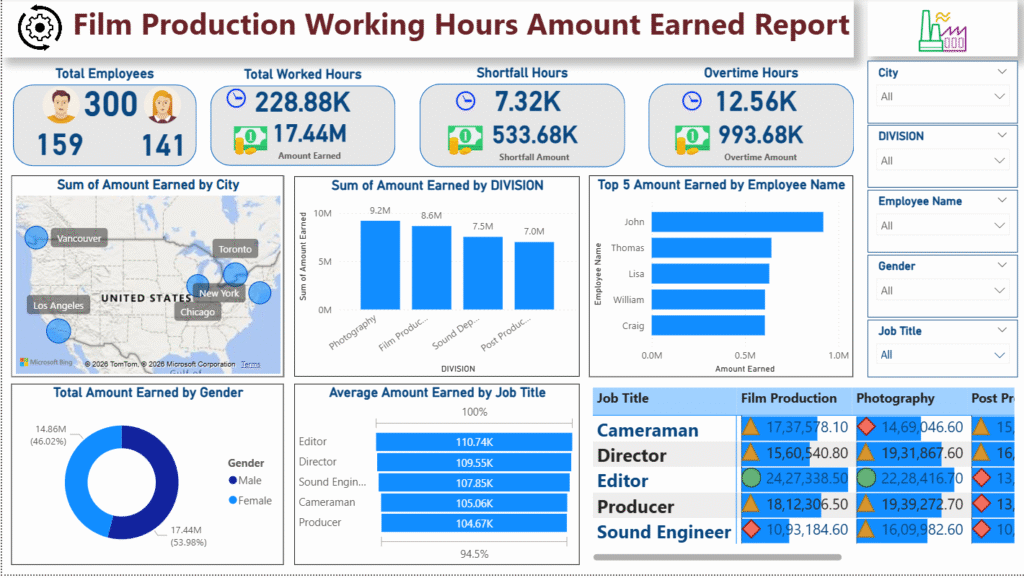
This Power BI project, Film Production Working Hours Amount Earned Report, is designed to give a comprehensive, decision-ready view of

2026 New Dashboard Design Tutorial Prepared by : Ankit Srivastava Get the Dataset Here Payroll Dataset When organizations talk about
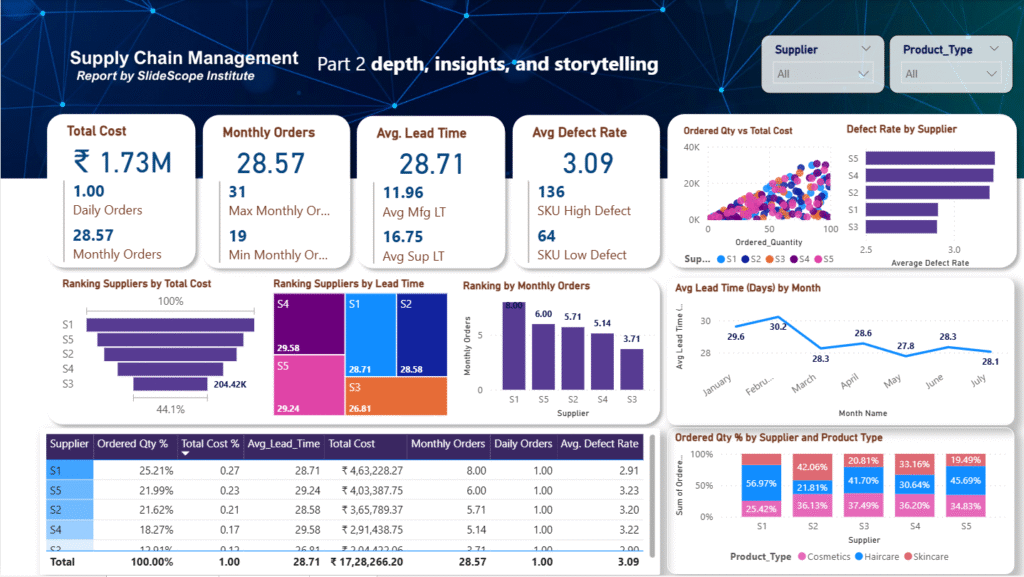
You already have strong core visuals. Now the goal is depth, insights, and storytelling, not clutter. Here is Part 1
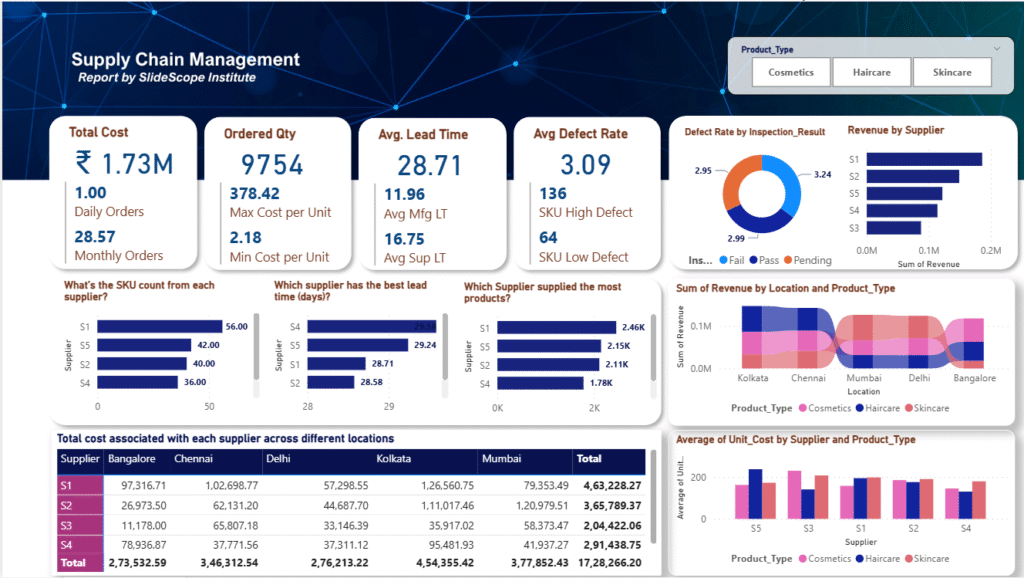
“I am excited to present this Supply Chain Management Dashboard, a practical and industry-aligned analytics solution designed to translate complex